A slow response does not necessarily mean one function is slow. It might come from one expensive call, many small synchronous calls, or callbacks draining the microtask queue. A CPU profile helps separate those cases by showing where execution time accumulated under load. section 11.3.1 section 11.5
A profiler periodically interrupts execution, records the call stack, and resumes. It aggregates those samples by function. If a function appears in 25% of samples, it was on the stack for roughly 25% of the recording—not necessarily called 25% of the time. Sampling estimates relative cost; it does not record every call. section 11.1.6
Choose a collection method for the question:
- Use `node --cpu-prof server.js` for a readable `.cpuprofile` with JavaScript functions, source locations, and sample counts. Open it in Chrome DevTools, including after an offline capture. section 11.1.6 section 11.1.3
- Use `node --prof server.js`, then process its V8 log with `node --prof-process isolate-0x*.log`, when JavaScript attribution is insufficient. Its report also accounts for categories such as garbage collection, compilation, C++ code, and shared libraries. section 11.1.6
These methods do not expose interchangeable views of execution. An inspector-based JavaScript profile can leave work outside the JavaScript stack as a gap or charge it to the triggering function. Read sample counts as evidence about engine time, not a precise bill for source-code statements. Profile formats and available diagnostics also vary by runtime. section 11.1.6 section 11.6
To investigate a stall:
- Check event loop delay and whether garbage-collection pauses align with its spikes. If delay is low, profile the suspected expensive function; if delay is high without matching GC pauses, profile the synchronous work. section 11.3.1
- Capture under load and sort the bottom-up view by self time to find the function consuming the most CPU directly. A dominant function suggests a hot spot; no dominant function can indicate accumulated small operations or microtask work. section 11.3.2 section 11.3.1
- Before changing the hot function, ask why it is hot. On Node.js, repeated optimize-bailout cycles in `--trace-deopt` point toward recompilation; otherwise inspect its algorithm and whether work can be reduced or cached. section 11.3.2 section 11.5
Figure 11.10 The performance profile details panel breaks down self time vs total time for each sampled function.
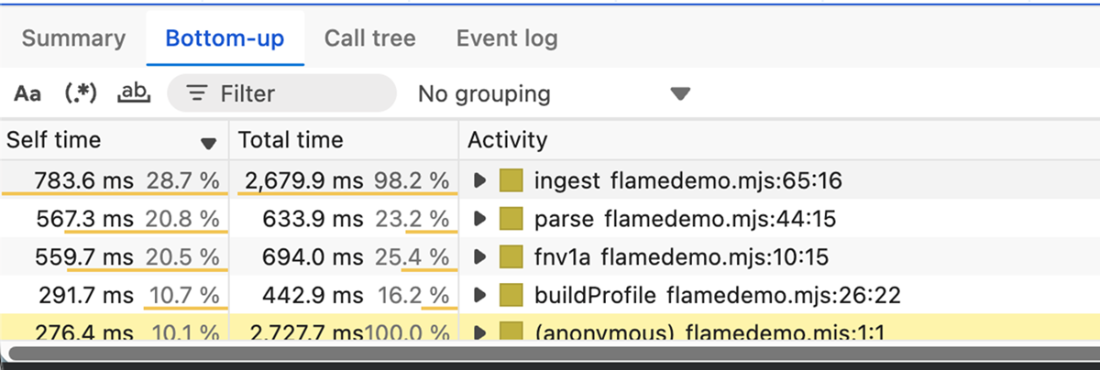
Use the profile details panel to distinguish a function’s self time from its total time before deciding which code to inspect. section 11.1.6

