cross_validate is a scikit-learn evaluation function for estimating how an estimator may perform on future data. It runs cross-validation, records model performance, and reports fit and prediction times, making it useful for comparing practical modeling approaches. section 4.3 section 4.3.1
A typical tabular-data workflow is:
- Choose an evaluation metric, such as RMSE for regression or accuracy for balanced classification. section 4.3
- Combine preprocessing and modeling in a single pipeline so each fold evaluates the complete workflow. section 4.3.1
- Define a cross-validation strategy, such as shuffled five-fold KFold, and pass the pipeline and scorer to cross_validate. section 4.3.1
- Inspect average and standard-deviation scores alongside fit and prediction times to judge both performance and consistency. section 4.3 section 4.3.1
Airbnb price baseline
A linear-regression pipeline can transform categorical and numeric Airbnb features, fit the model across five shuffled folds, and use RMSE to evaluate it. One reported run produced an RMSE of 33.949 with a standard deviation of 0.274, 0.06 seconds of fitting, and 0.01 seconds of prediction. This baseline can then be compared with feature-engineered alternatives. section 4.3.1
Figure 4.9 How data is distributed between train and validation across the folds of a five-fold cross-validation strategy
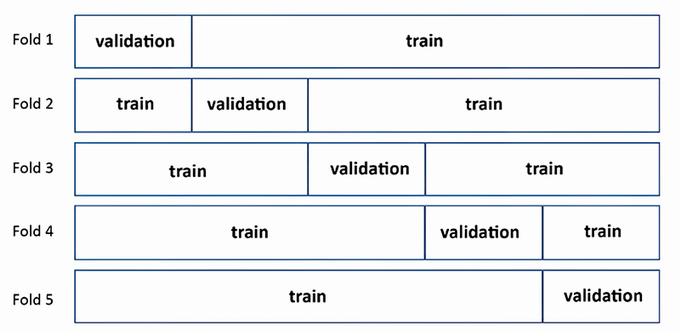
Use the five-fold visualization to see how training and validation data are distributed across folds. section 4.3
