The custom metrics API connects application-defined metrics to Kubernetes autoscaling. Prometheus can collect and store metrics, but an adapter service must expose them to the Horizontal Pod Autoscaler (HPA). section 6.2.2
Production use involves several practical constraints:
- Kubernetes provides custom.metrics.k9s.io alongside metrics.k8s.io and external.metrics.k8s.io for autoscaling beyond CPU and memory. section 6.2.2
- Only one adapter API service can be registered at a time for each custom or external metrics endpoint, complicating provider changes. section 6.2.2
- Prometheus Adapter works with Prometheus but requires metric configuration in a ConfigMap; KEDA offers broader Prometheus-based scaling and scaling to zero. section 6.2.2
Figure 6.7 Autoscaling based on a custom metric like GPU utilization requires several extra tools to work, including NVIDIA’s DCGM, a monitoring system like Prometheus Operator, and a custom metrics API like that provided by KEDA.
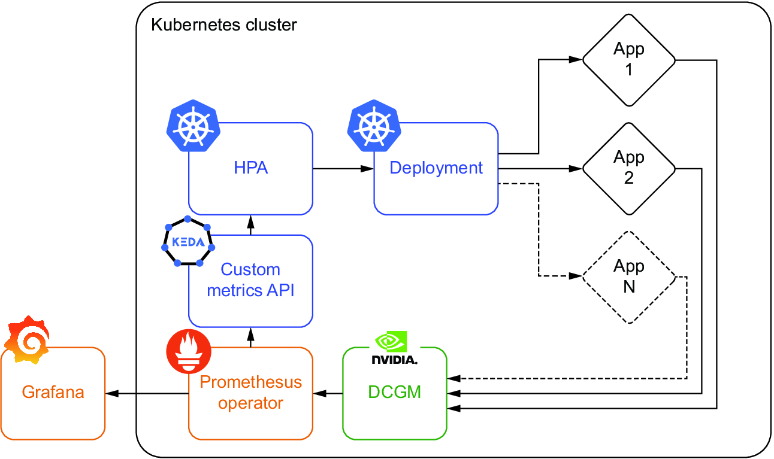
Use the architecture diagram to trace GPU-utilization autoscaling through DCGM, Prometheus Operator, and a custom metrics API. section 6.2.2
