The D3 margin convention reserves space around a chart for axes, labels, and legends. Declare top, right, bottom, and left margins, then place the inner chart inside that space. section 4.1.1 section 4.5
Use the convention in three practical steps:
- Estimate the space needed for annotations; adjust values later when labels or legends require more room. section 4.1.1
- Calculate innerWidth and innerHeight by subtracting the horizontal and vertical margins from the SVG dimensions. section 4.1.1
- Translate an SVG group by the left and top margins, creating a new origin for the plotting area. section 4.1.1
- Share dimensions and margins across multiple SVG containers when charts must align horizontally. section 5.1.1
A translated inner chart
const margin = {top: 40, right: 170, bottom: 25, left: 40}; const width = 1000; const height = 500; const innerWidth = width - margin.left - margin.right; const innerHeight = height - margin.top - margin.bottom; const innerChart = svg .append("g") .attr("transform", `translate(${margin.left}, ${margin.top})`); section 4.1.1
Figure 4.5 Translation applied to the SVG group that will contain the inner chart, creating a new coordinate system for the elements contained in the inner chart
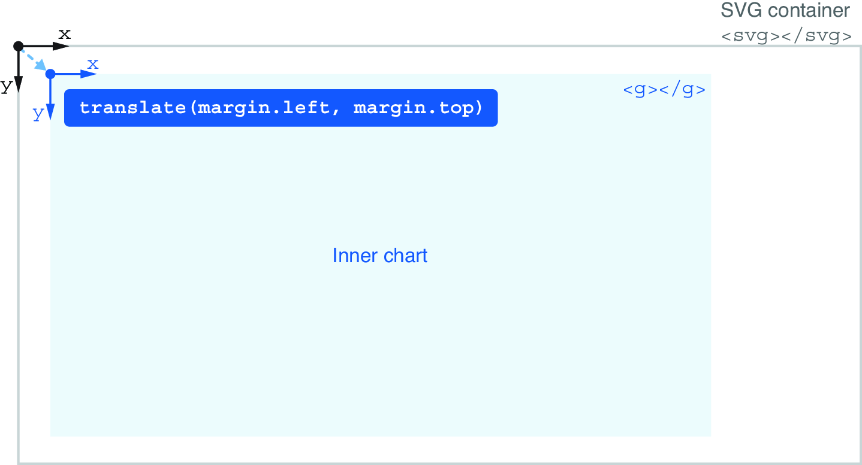
Visualizes how translating the SVG group creates a coordinate system for the inner chart. section 4.1.1
