A decision rule specifies how observed evidence leads to a decision. In Neyman–Pearson hypothesis testing, it translates a test statistic into a decision to reject or not reject the null hypothesis, using criteria fixed before the results are examined. The rule makes the conclusion reproducible while acknowledging that errors remain possible. section 4.1.5 section 4.0
Choose a significance level α and a statistical test, then define the critical region: values of the test statistic that lead to rejection. Equivalently, reject the null hypothesis when p ≤ α; otherwise, do not reject it. The p-value is the probability, assuming the null hypothesis is true, of a statistic at least as extreme as the observed one. Critical values mark the boundaries of the rejection region. section 4.1.5
Figure 4.1 Illustration of critical regions in a two-tailed hypothesis test at the 5% significance level. The curve represents the distribution of the test statistic under the null hypothesis. In a two-tailed test, the rejection regions are placed symmetrically in both extremes of the distribution, with 2.5% in each tail, so that results unusually far from the center in either direction would lead to rejecting the null. By contrast, a one-tailed test would place the entire 5% rejection region on only one side of the distribution, used when deviations are meaningful only in a single direction. This figure provides one example of how critical regions formalize the decision rule in hypothesis testing.
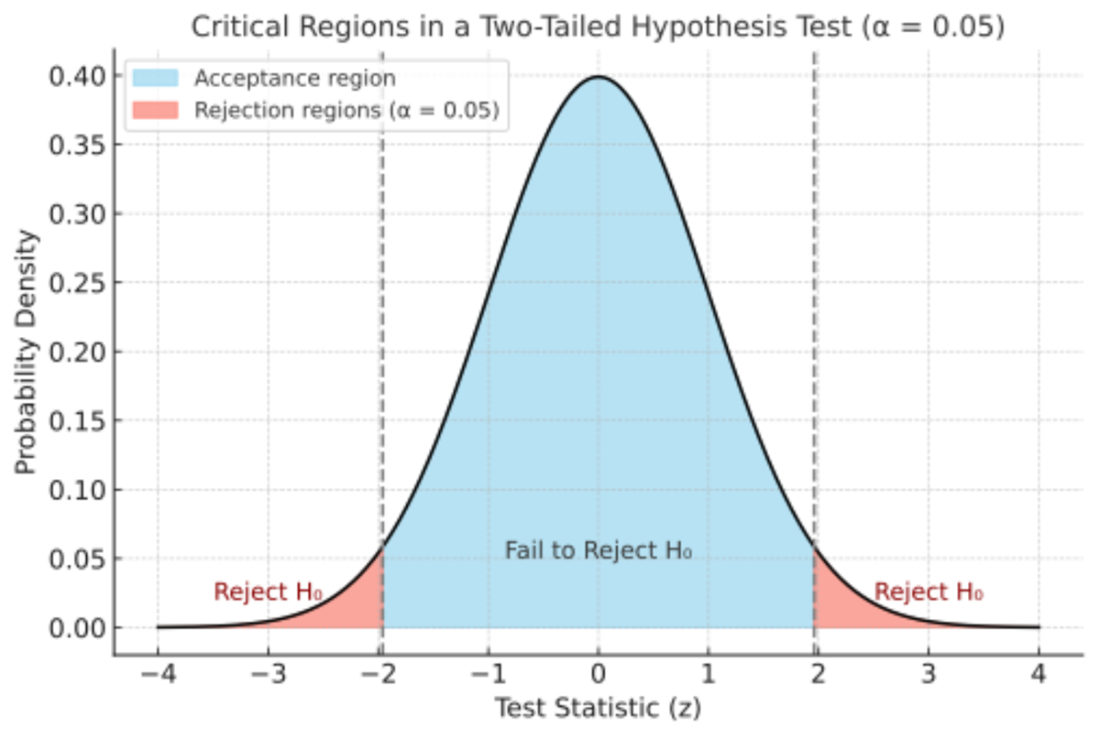
The figure contrasts two-tailed and one-tailed rejection regions at α = 0.05. section 4.1.5
A fill-volume test
A manufacturer tests whether average fill volume differs from 12 ounces. For a two-tailed t-test at α = 0.05, the rejection regions occupy 2.5% in each tail. With 20 containers, the observed t-statistic is approximately −2.24; with 19 degrees of freedom, it lies beyond the lower critical value of about −2.09. The rule therefore calls for rejecting the null hypothesis. section 4.2.1
A small clinical trial
A trial tests for improvement over a 50% recovery probability using a one-tailed exact binomial test at α = 0.05. For 20 patients, the rejection threshold is 15 recoveries. The observed 14 recoveries give p ≈ 0.057, so the researchers do not reject the null hypothesis. The result does not provide statistically significant evidence of improvement at the chosen level. section 4.2.3
A fixed threshold turns continuous evidence into a binary decision: p-values of 0.049 and 0.051 give nearly identical evidence but fall on opposite sides of α = 0.05. The significance level controls the long-run probability of a Type I error, while power influences the probability of a Type II error. The statistical decision alone does not establish a result’s practical importance. section 4.1.6
Setting the rule in advance limits the influence of observed results on the standard of evidence. With the hypotheses, test, significance level, and rule fixed, researchers applying the same framework to the same data should reach the same statistical conclusion. This discipline also helps guard against selectively modifying analyses to obtain significance. section 4.3.2