Decode generates output autoregressively, one token at a time from preceding context. For a 7B model, each generated token requires reading roughly the model’s full weight footprint, making decode bandwidth-bound on the measured CPU host. section 10.4.3
Compare decode deployments by throughput and cost per million generated tokens. In the Llama-2-7B Q4_K_M comparison, single-stream throughput is about 20 tokens/s on a CPU instance and 50 tokens/s on an L4 instance; at saturation, the L4 costs roughly 3.9 times less per token. section 10.1
CPU decode throughput
On a 22-vCPU host, Llama-2-7B F16 decode measures about 6.3 tokens/s, corresponding to roughly 80 GB/s of effective DRAM bandwidth. AVX-512+VNNI improves integer-format decode over AVX-2 by only 1.8–3.7%; the AMX-enabled build is slower across the measured quantized formats. section 10.4.3
Figure 10.1 Effective cost per million Llama-2-7B Q4_K_M tokens versus sustained demand, on Google Cloud c3-standard-22 (CPU-only, solid) and g2-standard-4 with one NVIDIA L4 (dashed) in us-central1 at on-demand list pricing. Each curve declines hyperbolically until the instance's single-stream throughput ceiling (CPU at 20 tok/s, GPU at 50 tok/s; tick marks at successive replica boundaries), then steps up as additional replicas absorb demand above ceiling. Below saturation the ratio between curves equals the ratio of hourly prices (1.57×). At the GPU's saturation the ratio is roughly 3.9×, widening further at higher demand because the CPU instance saturates at 2.5× lower throughput. The L4 wins on cost per token at every demand point in the plot; the gap is bounded between 1.57× and roughly 5×.
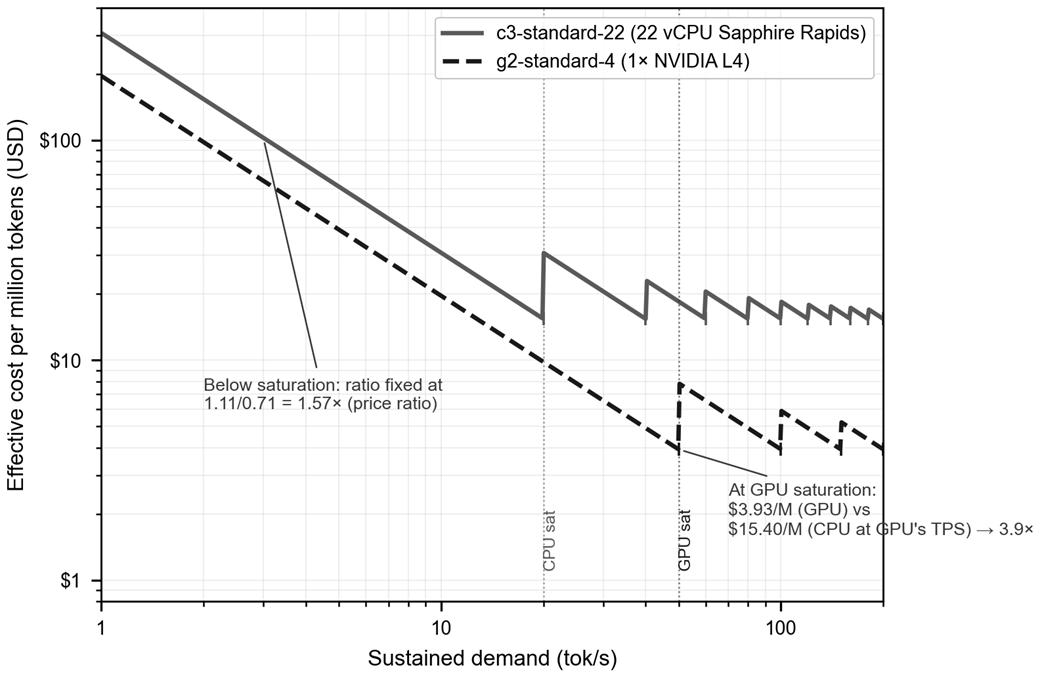
Compare estimated cost per million generated tokens across sustained demand, instance throughput ceilings, and replica boundaries. section 10.1
Figure 10.9 Decode throughput on Llama-2-7B across five quantization formats and three llama.cpp builds. F16 is flat across all three builds because it does not enter any of the integer dot-product instructions the build flags govern; its column measures the host's memory bandwidth alone. The integer formats show single-digit-percent gains from AVX-512+VNNI over AVX-2 and consistent regressions on the AMX-enabled build. Q5_K_M's regression on AMX is roughly three times the regressions Q4_K_M and Q8_0 seen on the same build.
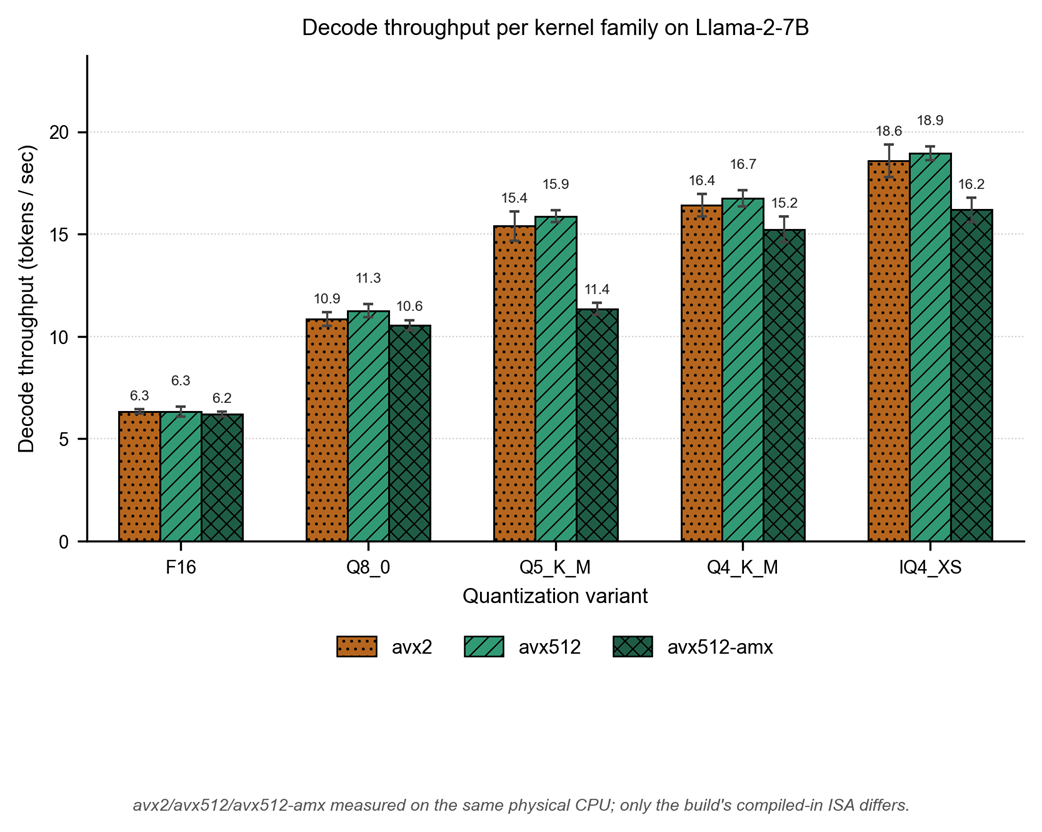
Compare measured decode throughput across quantization formats and llama.cpp builds. section 10.4.3