A demographic feature represents information about a person or group, such as age, gender, race, ethnicity, or location. In model evaluation, it helps reveal whether outputs reflect individual behavior or demographic stereotypes. section 3.1.1
Use demographic features diagnostically rather than treating every group difference as evidence of bias:
- Compare recommendations with personal viewing history to distinguish personalization from demographic stereotyping. section 3.1.1
- Hold preferences constant while varying demographics to isolate the feature’s effect on model outputs. section 3.1.1
- Inspect feature importance and compare demographic weights with behavioral signals such as ratings or watch history. section 3.1.1
- Log demographic attributes alongside session context and recommendation metadata to investigate subgroup failures. section 3.7.1
Movie recommendation audit
Create synthetic users with identical preferences but different age groups, then compare genre recommendations. If outputs vary, inspect whether the model over-serves Action and Comedy to younger users or Drama and Indie to older users, rather than assuming those differences are legitimate preferences. section 3.1.1
Figure 3.1 illustrates the input-output framework for diagnostic offline evaluations, showcasing how data, design, and metrics work together to identify potential issues in machine learning models. The input consists of data, such as historical interactions, user metadata, and labeled outcomes, which provide the foundation for the evaluation. The design process defines how this data is analyzed, using tools like subgroup analysis or visualization techniques, to produce actionable metrics like fairness scores or bias indicators as the output.
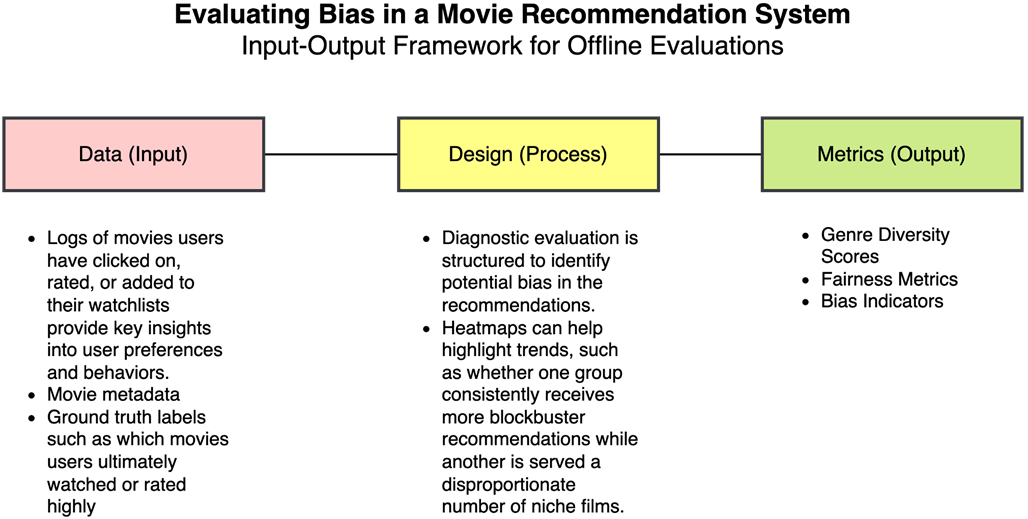
Trace demographic features through the diagnostic pipeline: combine user metadata with interaction data, apply subgroup analysis or visualization, and produce fairness scores or bias indicators. section 3.1.1
