Demographic parity is a fairness metric that checks whether demographic groups receive a positive model outcome at comparable rates. In a recommendation system, define the positive outcome first: receiving at least one blockbuster, long-tail, or category-specific recommendation in the top 10. Comparing these rates can reveal unequal exposure before it becomes an exclusionary product experience. section 3.2.2 section 2.1.2
A practical demographic-parity check follows these steps:
- Choose the groups and define the positive outcome precisely. section 3.2.2
- Calculate each group’s positive-outcome rate and select a reference group. section 3.2.2
- Compare groups using a disparity ratio and an absolute difference. section 3.2.2
- Investigate persistent differences alongside user behavior and preference rather than treating the metric as a verdict. section 3.2.2
Movie recommendations by age group
Suppose “positive” means receiving at least one blockbuster in the top 10. Set the 18–24 group as the reference, divide every group’s blockbuster rate by the reference rate, and calculate the absolute rate difference. A disparity ratio near 1.0 indicates similar exposure; values substantially above or below 1.0 signal a difference requiring investigation, not automatic proof of unfairness. section 3.2.2
Use demographic parity as a diagnostic offline evaluation or pre-flight check during model iteration. It can expose group-level disparities before an A/B test, but it should be interpreted with product goals, actual preferences, and other fairness measures such as equality of opportunity. section 2.1.2 section 3.2.2
Figure 3.8 represents how the demographic parity is calculated. The variable P(recommendation|groupA) refers to the probability that someone in group A (e.g., a demographic group like "female users" or "users aged 18-25") receives a recommendation from the model. It measures how often the model recommends something to members of group A compared to other groups. The same applies for P(recommendation|groupB) but for group B. If these probabilities differ significantly between groups, it suggests that the model may not be treating the groups equitably, potentially signaling bias.
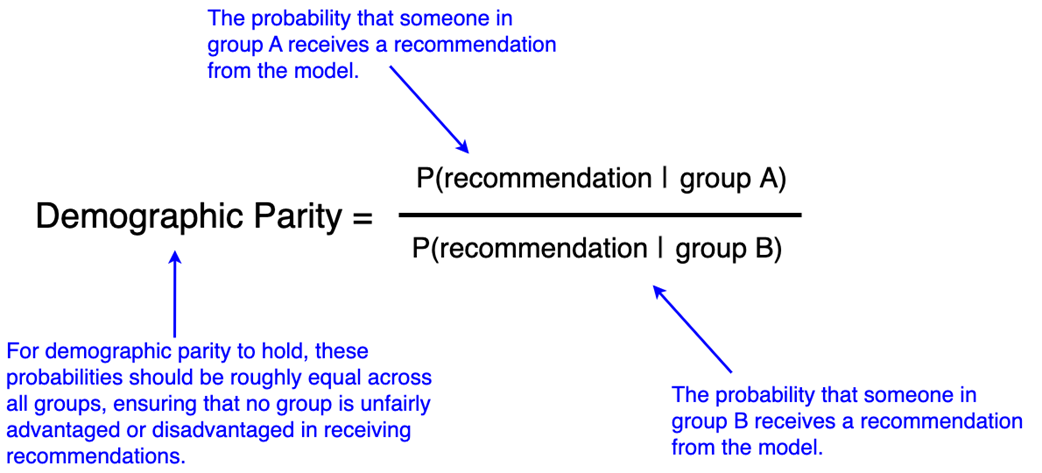
Compare the conditional recommendation probabilities for two demographic groups to see how unequal positive-outcome rates indicate possible bias. section 3.2.2
