Developer satisfaction measures how much AI tooling helps developers in daily work. It is subjective, but useful because it reflects tool fit, workflow friction, and conditions that may affect retention. section 9.4.2
Treat satisfaction as an operational signal rather than proof that an AI investment is worthwhile:
- Measure it monthly with an anonymous 1–5 question about how much AI tooling helps daily work. section 9.4.2
- Segment results by work context: satisfaction was lowest on compliance-restricted work and highest on greenfield work. section 9.4.2
- Pair the score with cycle time, throughput, test coverage, cost, and first-attempt quality; no single metric proves that tooling is worthwhile. section 9.4.2
- Attach an action to a threshold: investigate below 3.8, then use a team retrospective to identify what degraded. section 9.4.4
A satisfaction score with a response protocol
A monthly average of 4.1 out of 5 can support an AI-tooling health picture, but it should not stand alone. If the score falls below 3.8, schedule a team retrospective rather than immediately changing models or prompts. Compare the result with quality, cost, and cycle-time trends before choosing an intervention. section 9.4.2 section 9.4.4
Figure 9.7 Visualization of the potential dashboard - state of the art.
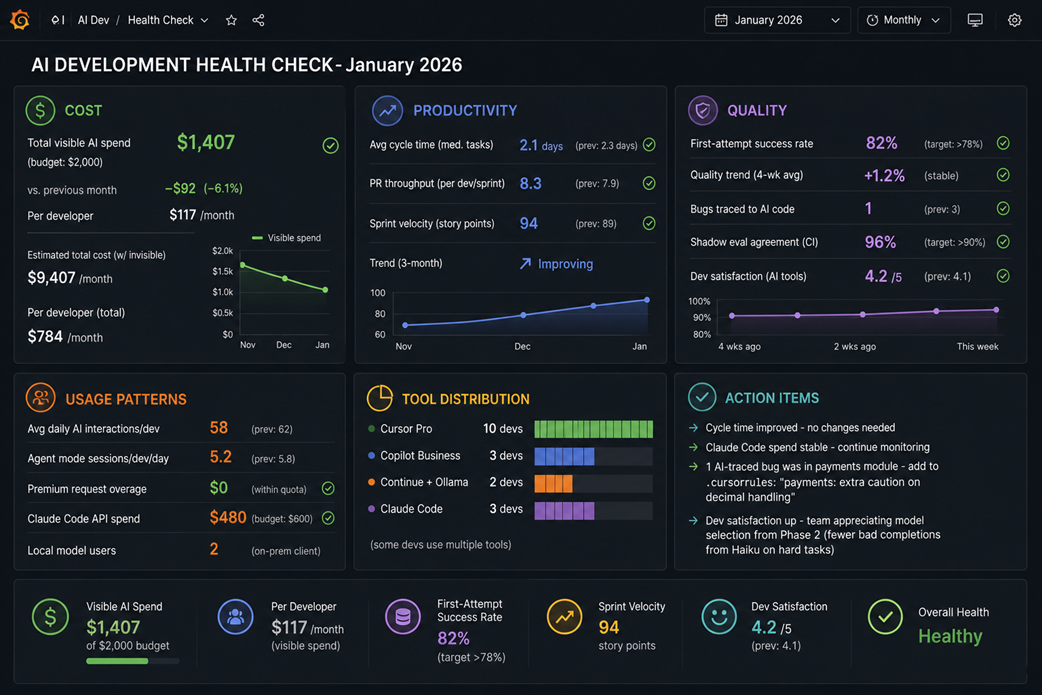
Use the dashboard visualization to place satisfaction beside other health-check metrics and connect each reading to an explicit response. section 9.4.4

