A diagnostic metric reveals specific strengths, weaknesses, or failure patterns in model behavior. Unlike a headline performance number, it helps explain what needs attention before behavior shapes the product experience. section 3.2
Use diagnostic metrics to turn aggregate performance into product questions: which users receive weaker recommendations, whether content becomes repetitive, or whether popularity hides important categories. Compare each result with a meaningful baseline, such as production, a previous version, another segment, or aggregate performance. section 3.3.1 section 3.6.3
Figure 3.11 illustrates this decision flow. Performance metrics may look acceptable at first, but diagnostic evaluations can reveal that a specific segment is receiving lower-quality recommendations. That insight leads to a product hypothesis, then a targeted model or data intervention, and finally validation through online or downstream product metrics.
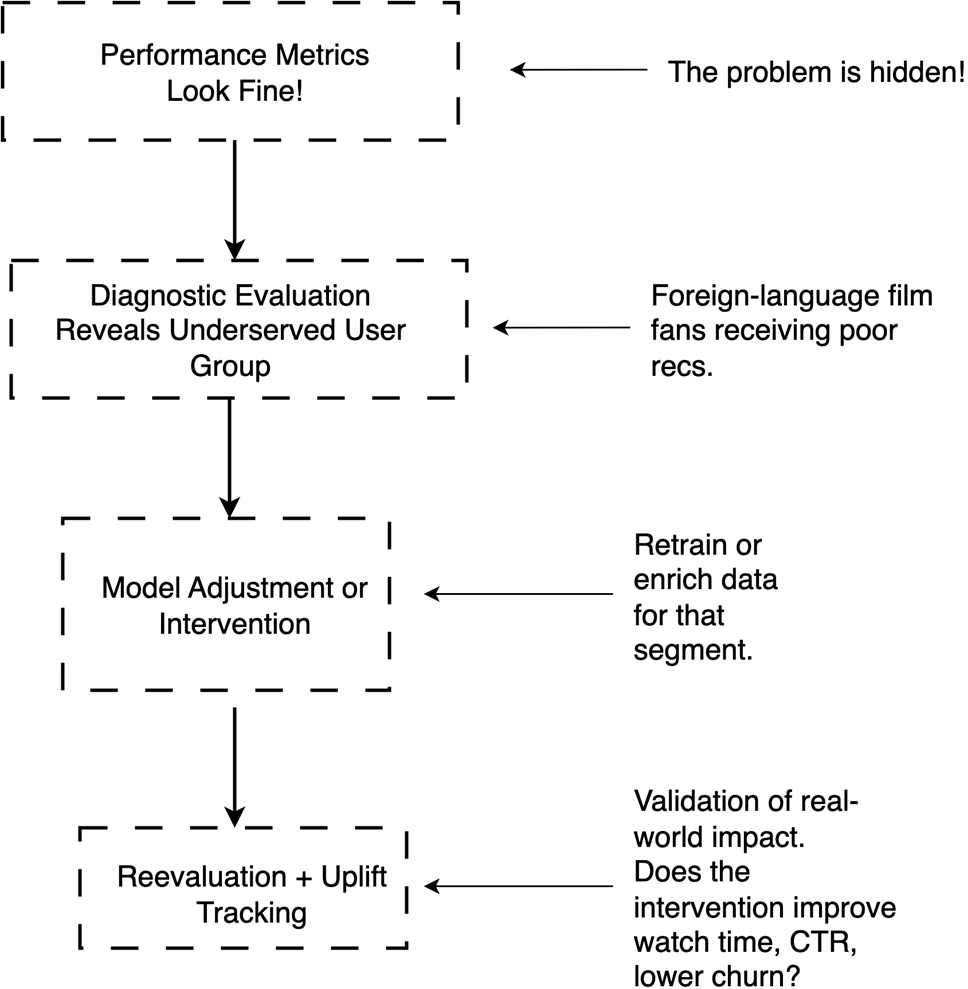
Follow the diagnostic workflow from an apparently acceptable aggregate result to a segment-specific product hypothesis, targeted model or data intervention, and online or downstream validation. section 3.3.1
Movie recommendations
An overall recall of 28% may look acceptable, while recall for foreign-language film fans remains below average. That gap turns a vague concern into a product decision: prioritize retraining, monitor the segment, or accept the difference based on strategy and engagement. In a metric hierarchy, genre diversity, cohort fairness gaps, and latency explain movements in proxy metrics such as CTR and watch time, while retention remains the outcome. section 3.3.1 section 8.5.1
