Distance quantifies how separated or dissimilar two observations are. Outlier detectors often compare a record with other records: being far from most can indicate an outlier, but distance becomes less reliable as dimensionality grows. section 3.1.3
Figure 3.1 A scatterplot of features A and B (left) and scatterplot of features C and D (right). A point (drawn as a star) is shown that is an outlier in A, though is normal in features B, C, and D. Its distance to the other points in 4D space will separate it well from the other points, but this could fail in much higher dimensional spaces.
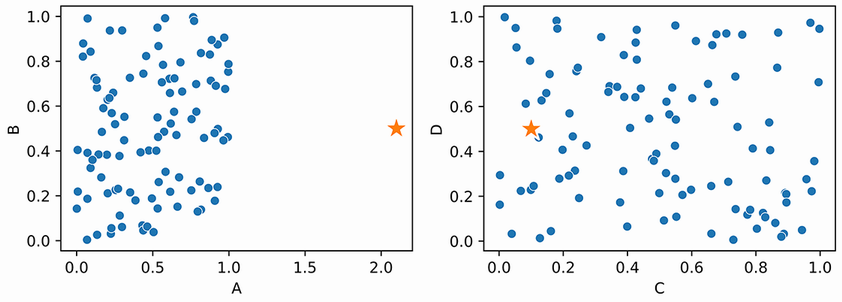
The figure contrasts a point that stands out in one feature but is ordinary in others with the risk that added dimensions make its distance less distinctive. section 3.1.3
Distance choices and preparation affect what a detector treats as unusual:
- Euclidean, Manhattan, Mahalanobis, and other measures can produce different distances; the useful choice depends on the project. section 9.7
- Scale numeric features to comparable ranges so larger-valued features do not dominate distance calculations. section 3.2
- For mixed data, combine numeric and categorical distances with a weight; one-hot encoding can also affect distances by giving categorical features more influence. section 9.7.4 section 9.4.1
- In high-dimensional data, distances can become nearly equal; removing features or reducing dimensionality, such as with PCA, can help address this limitation. section 3.1.3
Comparing related time series
For air-quality measurements, scale PM2.5, PM10, and SO2, then calculate pairwise differences. Unusually large divergences can help flag times when one series departs from the others, though the flagged cases still need interpretation. section 17.2.9