A film distributor becomes analytically useful when stakeholders ask which companies changed most after lockdowns. The relevant records combine each distributor’s annual market share, number of films released, and total gross box office revenue. section 5.4.3 section 5.2.1
A practical distributor analysis proceeds by:
- Select distributor tables alongside admissions and genre data, then verify that the same structures exist across annual files. section 5.4.1
- Assign pre-COVID, during-COVID, and post-lockdown periods so changes can be compared consistently. section 5.4.3
- Check whether yearly market shares total 100%, allowing for documented rounding errors. section 5.4.3
- Normalize entity names before reshaping the data, merging alternate names, starred names, and separate Other categories. section 5.4.3
- Keep distributors present across all years, pivot market share by year, and plot comparable trends over time. section 5.4.3
Resolving distributor identities
A longitudinal comparison would otherwise treat 20th Century Fox* and 20th Century Fox as different companies, or split eOne Films from Entertainment One. Replacing these variants and combining labels beginning with Other produces a more interpretable market-share trend. section 5.4.3
Figure 5.30 A snapshot of the distributors dataset
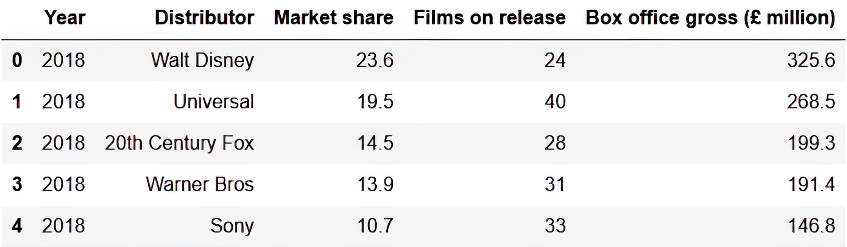
Inspecting the distributor dataset helps establish the available fields before choosing comparisons or interpreting market-share changes. section 5.4.3
