DORA is a software delivery performance framework built around deployment frequency, lead time for changes, change failure rate, and time to restore service. Together, these measures show how quickly and reliably teams deliver changes and recover from failures. section 3.4.3 section 10.1.2
Use the four metrics to connect delivery performance with operational outcomes:
- Deployment frequency measures how often successful changes reach production; interpret it alongside the platform capabilities that can actually influence delivery. section 3.4.3 section 10.1.2
- Lead time for changes measures elapsed time from code commit or story pickup to production, revealing delays in build, test, approval, or dependency planning. section 3.4.3 section 10.1.2
- Change failure rate measures the proportion of production deployments that fail, linking delivery speed to reliability, downtime, and user trust. section 10.1.2
- Time to restore service measures recovery after failure; detection and notification time are important parts of understanding recovery performance. section 3.4.3
Treat DORA as a lagging view of delivery outcomes, not as a complete platform scorecard. Pair it with leading indicators such as deployment automation, pipeline-stage duration, code-quality violations, test coverage, manual-test ratios, and developer satisfaction. This combination helps teams identify bottlenecks before they appear in the four headline metrics. section 10.1.1 section 10.1.2
Epetech’s measurement approach
Epetech used the four DORA metrics to track delivery and reliability while examining the underlying causes. It monitored automated-deployment percentages and per-team deployment frequency, broke lead time into build, test, and approval stages, and used quality and testing indicators as early warnings for failed production changes. section 10.1.2
Figure 10.2 Key leading metrics used by Epetech to understand and use the DORA lagging metrics
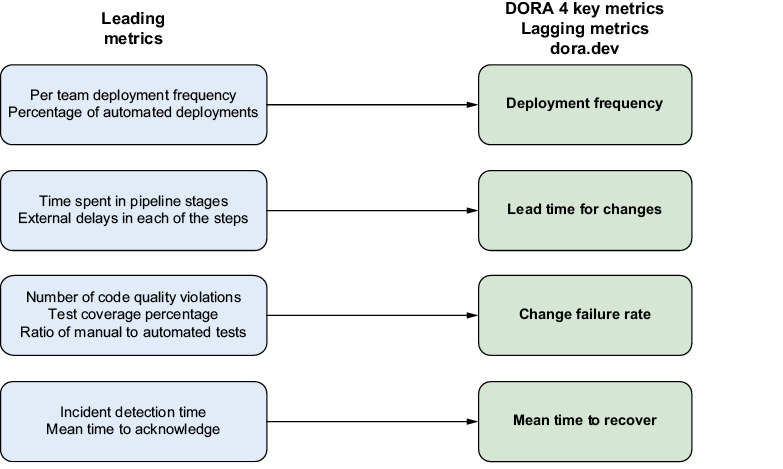
Use the leading-metrics diagram to trace how automation, pipeline timing, code quality, and testing inform the four DORA outcomes. section 10.1.2