A drift score measures how much a production text distribution differs from a reference distribution. With centroid cosine similarity, it is 1 minus the cosine similarity between the average vectors for the two sets: 0 means identical distributions; 1 means completely orthogonal ones. section 9.2.2
A lightweight detector vectorizes both sets with a shared TF-IDF vocabulary, averages each set into a centroid, then compares the centroids. TF-IDF captures vocabulary differences but ignores grammar and word order. For richer semantic vectors, sentence-transformer embeddings or another encoder can replace TF-IDF without changing the centroid-and-cosine calculation. section 9.2.2 section 9.2.2
Treat the score as a signal to investigate, not a decision by itself. Calibrate thresholds against a same-domain baseline, ideally comparing production and training sets of similar size. Inspect the terms most prominent in production but weak in training to identify what changed; a red signal can trigger a canary before any retraining decision. section 9.2.3 section 9.2.3
python -m chapter09.drift_detector \
    --reference data/it_support/train.jsonl \
    --production data/it_support/valid.jsonl \
    --output chapter09/eval/drift_report.json
Reference prompts: 450
Production prompts: 50
Drift score:         0.1859
Centroid similarity: 0.8141
Alert level:         YELLOW

Moderate drift detected -- investigate recent inputs.
Example baseline run: 450 training prompts versus 50 validation prompts produced a 0.1859 score and a yellow alert. Use a same-domain result as a calibration reference, while accounting for sample size. section 9.2.3
Table 9.4 Top drift terms from the shifted production run
|
Term
|
Drift weight
|
|
sso
|
0.076
|
|
kubernetes
|
0.063
|
|
deployment
|
0.052
|
|
container
|
0.051
|
|
configure
|
0.040
|
|
pod
|
0.038
|
|
pods
|
0.033
|
|
cloud
|
0.032
|
A simulated shift to Kubernetes-based CI and cloud SSO raised the score to 0.686; the leading drift terms identify the newly prominent topics. section 9.2.3
Figure 9.3 Responding to a drift signal: a red drift score triggers a canary run before any retrain decision.
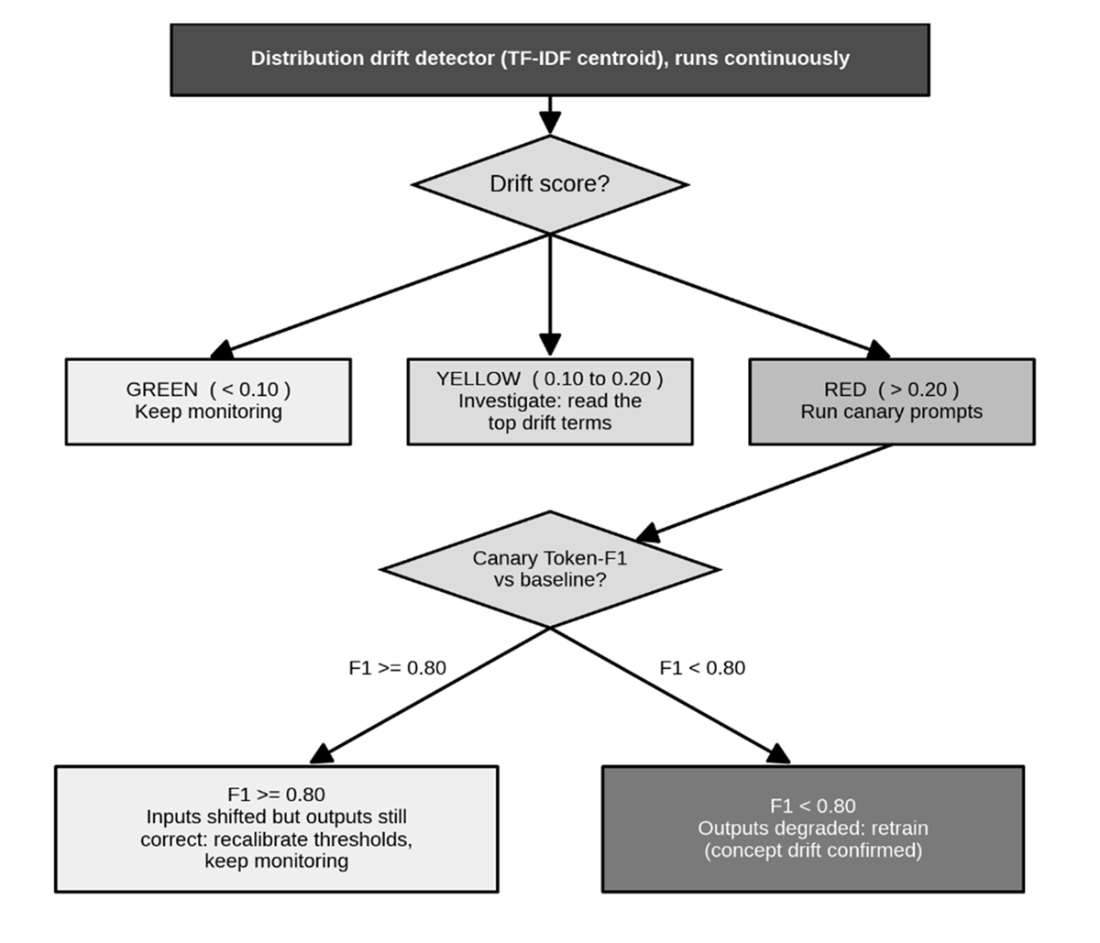
Use a red score to trigger a canary run before deciding whether to retrain. section 9.2.3