A spiderweb visualization encodes data attributes through a spiderweb-like graphic. Its geometry and styling can vary while retaining the recognizable web form. section 14.6
Map data to visible characteristics such as:
- overall size section 14.6
- number of spindles section 14.6
- number of concentric rings section 14.6
- web “sagginess” and associated spider color section 14.6
Horror novels
Represent each of the top 20 horror novels as a spiderweb. Derive its size, spindles, rings, web shape, and spider color from attributes including pages, genres, age, and general rating. section 14.6
Figure 14.21 The novels’ data is visualized with the size, number of spindles, number of concentric rings, and the “sagginess” of the spiderwebs, as well as the color of the associated spiders.
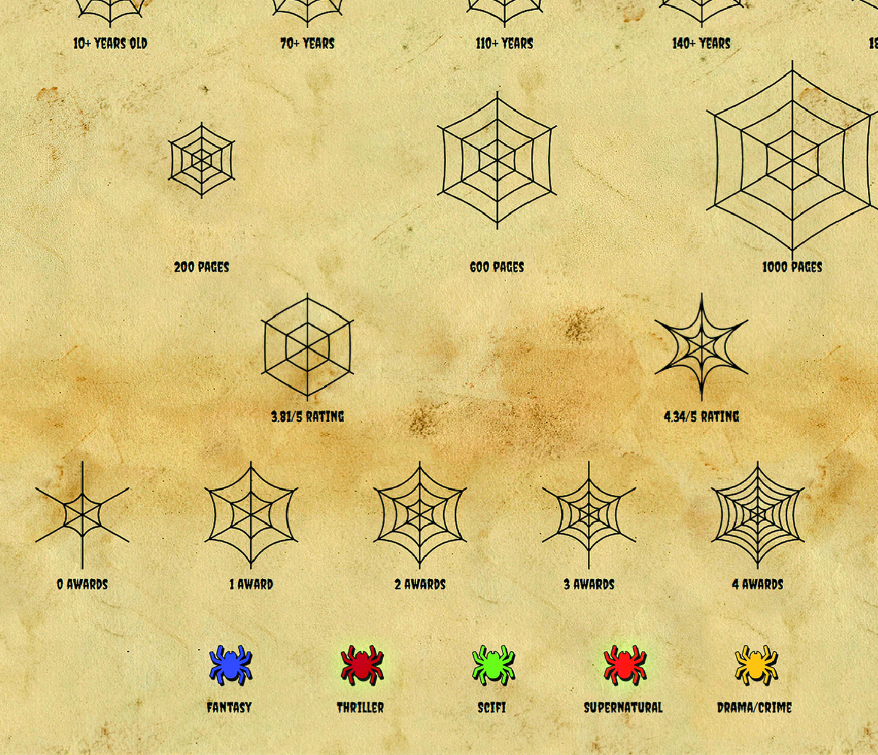
Inspect the figure showing how novel data controls web size, spindles, rings, sagging, and spider color. section 14.6
