liveBook · Manning

Encoding channel

As explained in D3.js in Action, Third Edition

A visual channel is a visual encoding dimension, such as position, length, color, or shape, that represents data values.

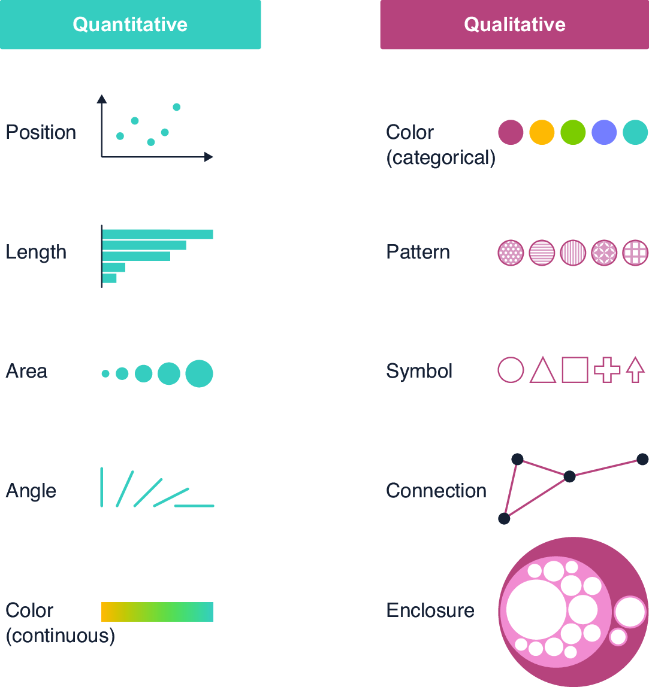
An encoding channel is a visual dimension that represents data, such as position, length, area, angle, color, pattern, symbol, connection, or enclosure. section 14.2

Choose channels according to the data type:

  • Use position, length, area, angle, or continuous color scales for quantitative data. section 14.2
  • Use categorical color, patterns, symbols, connections, or enclosure for qualitative data. section 14.2
  • List dataset attributes, classify them as quantitative or qualitative, and brainstorm suitable channels before implementation. section 14.2

A timeline of Van Gogh’s work

Represent each painting with a circle positioned on a timeline. Encode its subject with color, dimensions with size, and medium with the border; show drawings and letters with bar length and area. section 14.2

Figure 14.2 Quantitative data is often visualized with position, length, area, angle, and continuous color scales, while qualitative data uses categorical color scales, patterns, symbols, connections, and enclosure.
figure

Compare common quantitative and qualitative channels at a glance. section 14.2

How D3.js in Action, Third Edition covers it

How deep it goes
Explains channel categories and selection by data type, then stops short of detailed implementation.
Examples
Uses scatterplots, bar charts, pie charts, network graphs, circle packs, and a Van Gogh timeline visualization.
What it assumes
Assumes datasets with identifiable attributes and teaches classification into quantitative and qualitative data.
What you can do after
Build it from scratch by matching dataset attributes to visual channels in a custom D3 visualization.
How it connects
Connects quantitative data, qualitative data, color scales, timelines, and custom visualization design.

Also explained in

Compare how 2 books explain encoding channel →

Related concepts

This explainer was generated by Manning's knowledge graph from the text of D3.js in Action, Third Edition. The section links point to the parts of the book it draws on.
