An execution graph is the runtime path a particular request actually traverses: components, connections, branches, and work performed before and after the response. It is narrower than a service list because runtime data—such as a user's plan, role, region, feature flags, and integrations—selects the path. section 9.5
Figure 9.7 A subway map showing how requests from different user plans trace unique paths through the same shared architecture. The green "Free" route hits the core services: browser, web/api, database, calendar/video, and email. The orange "Paid" route adds a call to the payment processor. The purple "Enterprise" route touches every component, adding single sign-on (SSO), audit logging, and CRM syncs. A single value in the database (the user's plan) determines which path a given request follows at runtime.
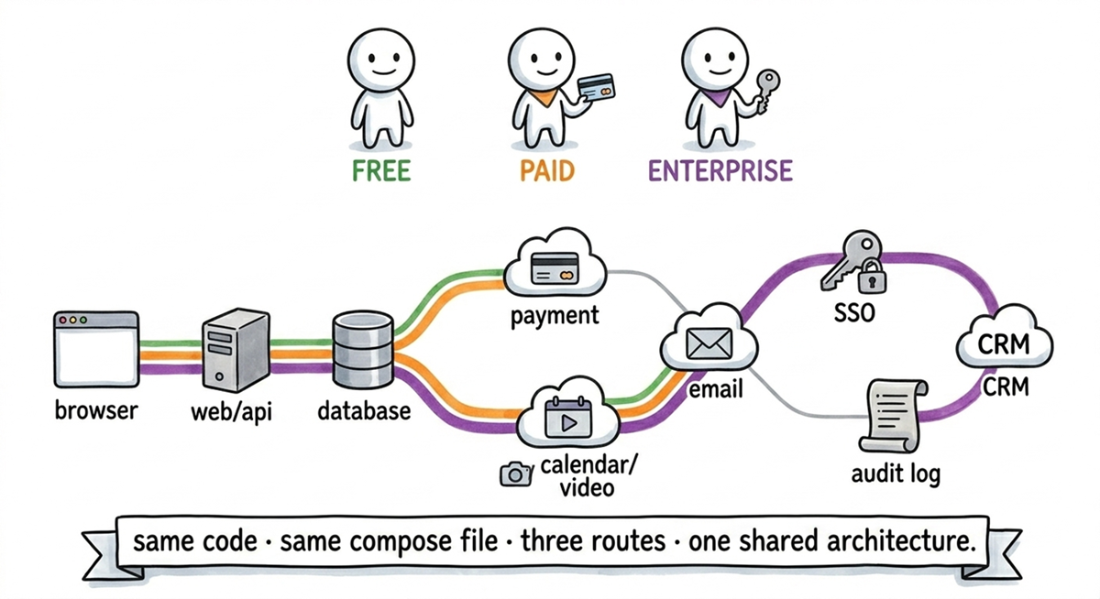
Compare Free, Paid, and Enterprise requests as distinct paths through shared services; the user's plan in the database selects the route at runtime. section 9.5
Use an execution graph to ask sharper architectural questions:
- Which services did this specific request actually reach, rather than which services appear in docker-compose.yml? section 9.5
- Which runtime values—plan, role, region, flags, or integrations—added or removed branches? section 9.5
- What happened synchronously before 200 OK, and what continued asynchronously through queues and workers afterward? section 9.5