An expected count is the frequency or proportional occurrence predicted for a category when the null hypothesis assumes no differences between categories. Comparing expected counts with observed counts reveals disproportionality. section 5.2.3
Expected counts support several categorical-data comparisons:
- Goodness-of-fit compares one sample’s observed frequencies with expected frequencies. section 5.2.3
- A test of independence compares expected and observed frequencies across two categorical variables in a contingency table. section 5.2.3
- Counts may represent observations or proportions, while trend tests examine categorical patterns across time or groups. section 5.2.3
Recommender clicks by country
For recommender assignments and country-level clicks, expected values distribute each recommender’s total according to the country proportions. Comparing these values with observed clicks produces a chi-square statistic and p-value; a heatmap makes cell-level differences easier to interpret. section 5.2.3
Figure 5.15 Human-readable heatmap of differences between observed and expected click rates
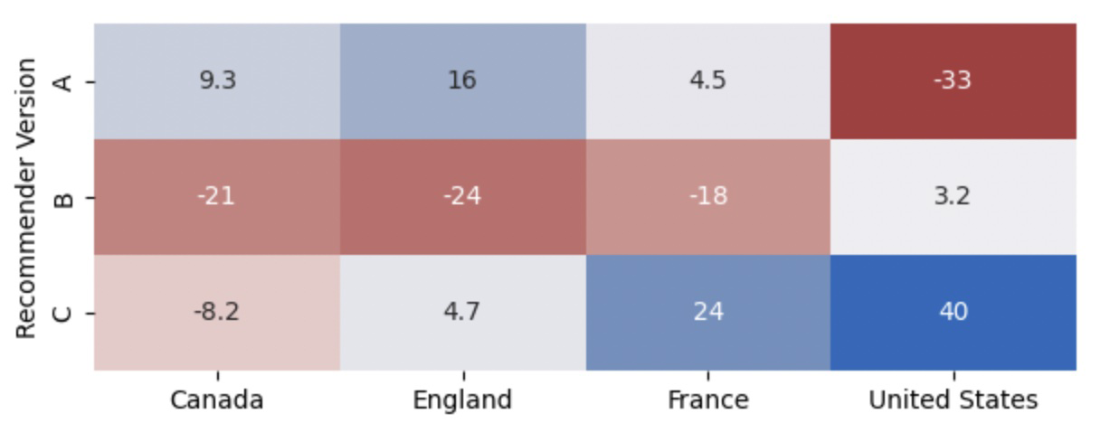
Use the heatmap to inspect where observed click rates exceed or fall below expected values. section 5.2.3
