Explained variance measures how much of a dataset’s variability is retained by a representation or statistical model. In PCA, it ranks principal components by the variance they explain, helping choose a reduced dimensionality without discarding too much information. section 6.2.3
Use explained variance to select the number of principal components:
- Retain components until they explain a chosen percentage of total variance, such as 95% or 99%. section 6.2.3
- Compare this choice with the eigenvalue criterion or the elbow in a scree plot; the elbow is more subjective. section 6.2.3
Reducing binding-constant data
For lnKD measurements in a small-molecule RNA-binding study, selecting components that preserve 99% explained variance reduced the dataset to 32 dimensions. PC1 explained 28.77% and PC2 explained 21.70%, together retaining 50.47% of the variance. section 6.2.3
Figure 6.9 PCA defines a new coordinate system based on principal components, where the important dimensions are self-evident, and we can reduce the data dimensionality to k by retaining the first k PCs as ranked by the amount of variance they explain.
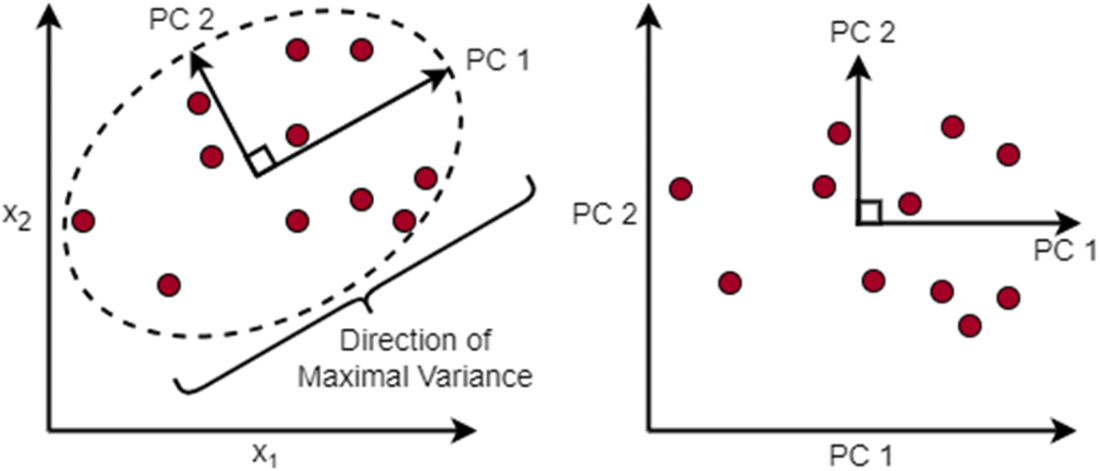
See how PCA creates a coordinate system whose dimensions are ranked by explained variance, making dimensionality reduction possible. section 6.2.3
