An exporter exposes telemetry from an external system in a format that a monitoring system can collect. In a Prometheus setup, an exporter makes metrics from systems such as Kafka or an IoT device available for scraping. In an OpenTelemetry Collector pipeline, an exporter sends processed signals to a backend. section 3.5.2 section 4.3.2
Exporters solve two closely related integration problems:
- Bridge systems you do not own into a monitoring workflow, such as exposing message-queue or IoT metrics for Prometheus to scrape. section 3.5.2
- Deliver signals from an OpenTelemetry Collector to destinations such as Prometheus or Jaeger after receivers and processors have handled them. section 4.3.2
- Adapt incompatible signal paths when necessary; for example, a proxy can turn log-file output into stdout for cloud-native use. section 3.5.2
A collector exporting metrics and traces
A Collector can scrape ho11y metrics with a Prometheus receiver, batch them, and export them through a Prometheus exporter at 0.0.0.0:9292. A separate traces pipeline can receive OTLP data, batch it, and export it to Jaeger at jaeger:14250. Prometheus then scrapes the Collector’s exposed endpoint, while Jaeger receives the traces.
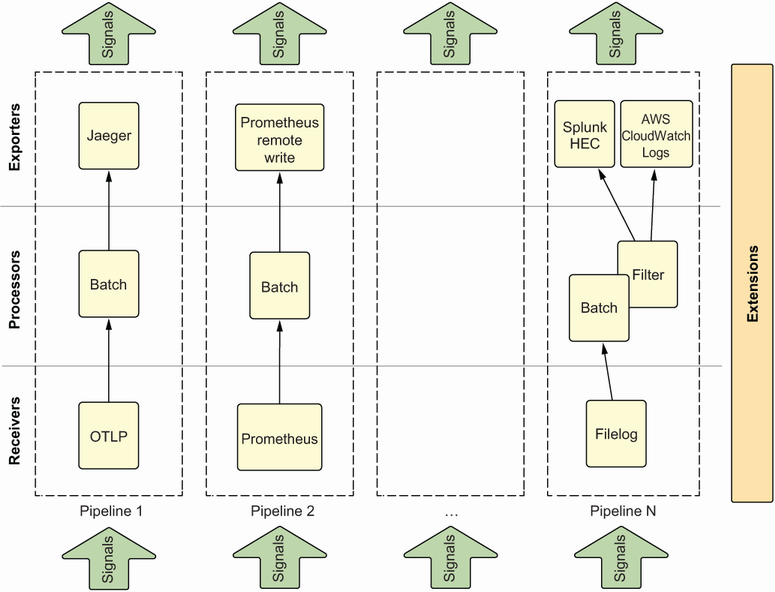
Use the component diagram to trace how receivers, processors, and exporters form an OpenTelemetry Collector pipeline. section 4.3.2
