An exposure metric measures the amount or type of content a recommendation system presents to users. Comparing exposure across segments can reveal groups receiving narrower recommendations or different mixes of content. section 3.1.1
For a movie recommendation diagnostic, combine recommendation outputs with user attributes and movie metadata. Define segments, choose attributes to compare, calculate metrics, and visualize the results. Useful measures include genre percentages, average popularity or release year, language coverage, and catalog diversity. section 3.1.1
Genre exposure by age group
Group recommended movies by age group and genre, count them, and normalize each age-group row to obtain proportions. Compare the resulting genre distributions to see whether some groups receive a narrower mix. section 3.1.1
Listing 3.1 Analyzing Distribution of Genres by Age Group Cohorts
# Calculate the distribution of genres within each age group's recommendations
genre_diversity = analysis_df.groupby(['age_group', 'genre']).size().reset_index(name='count')
genre_pivot = genre_diversity.pivot(index='age_group', columns='genre', values='count').fillna(0)
genre_pivot = genre_pivot.div(genre_pivot.sum(axis=1), axis=0)  # Normalize by row to get proportions

genre_pivot
The listing groups recommendations by age and genre, pivots the counts, and normalizes each row. section 3.1.1
Figure 3.2 This heatmap shows how recommendation exposure varies by age group and genre. Darker cells indicate higher exposure. The goal is not to assume every difference is a problem, but to identify patterns that may require deeper investigation.
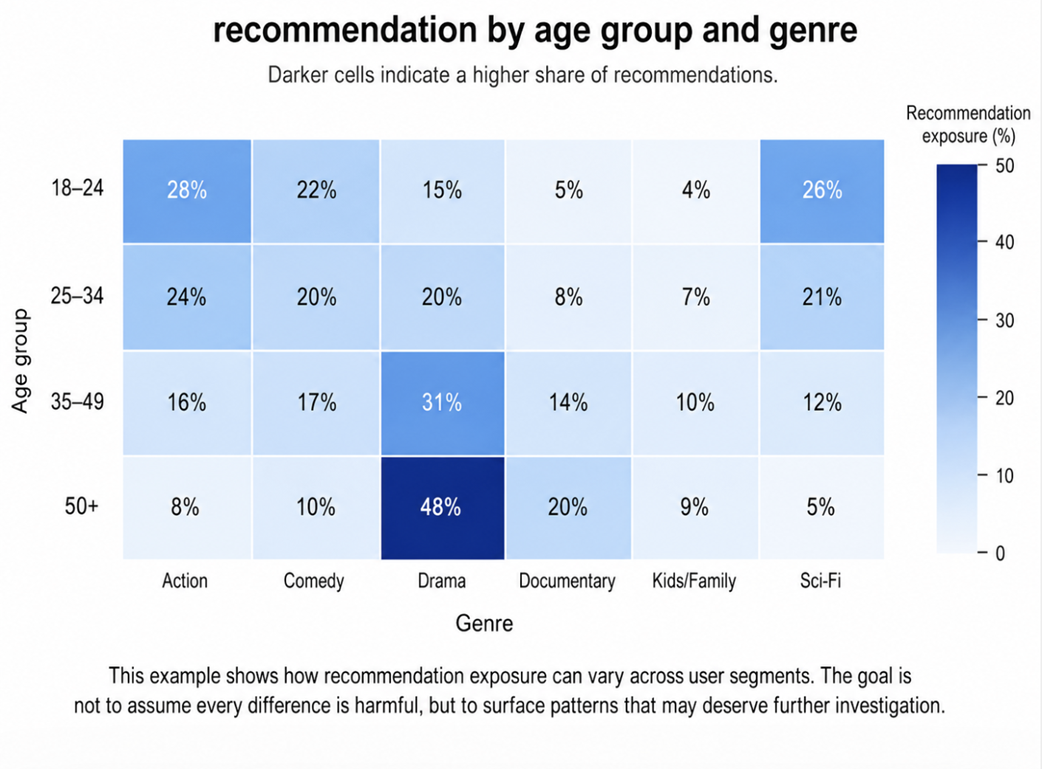
A heatmap makes differences in genre exposure across age groups easier to spot. section 3.1.1
Differences in exposure are not automatically unfair or harmful. Investigate whether they reflect user preferences and relevance, and whether the recommendation experience aligns with product goals. Watched or highly rated movies can help with comparisons to preference. section 3.1.1
