The F-statistic evaluates the overall significance of a regression. It compares variance explained by the predictors with unexplained variance relative to a model containing only an intercept. section 4.2.3
A large F-statistic indicates that the predictors explain more variation in the response than the intercept-only model. Its value has no immediate interpretation by itself; assess it against a critical value or, preferably, its associated p-value. section 4.2.3
Interpret the statistic alongside the rest of the regression output:
- Use SSR, SSE, the observation count, and predictor count to calculate the statistic. section 4.2.3
- Select a significance level, then locate the corresponding critical value using the predictor count and observation count minus one. section 4.2.3
- Evaluate the model p-value rather than making a null-hypothesis decision from the F-statistic alone. section 4.2.3
- Check R-squared, coefficient p-values, and regression assumptions before treating overall significance as reliable. section 4.3
Simple regression example
A regression predicting stage2 from stage1 produces an F-statistic of 24.35. At the 5% significance level, the relevant F-table value is 4.38, using one predictor and 19 observations minus one. Because 24.35 exceeds 4.38, the model explains a statistically significant amount of response variance; the associated p-value still determines the formal hypothesis decision. section 4.2.3
Figure 4.6 A snippet from a typical F-table where the selected significance level equals 5%. The critical value is located at the intersection of the predictor count (1) and the observation count minus 1 (19). Because the F-statistic is greater than the critical value, the model explains a statistically significant amount of the variance in the response variable.
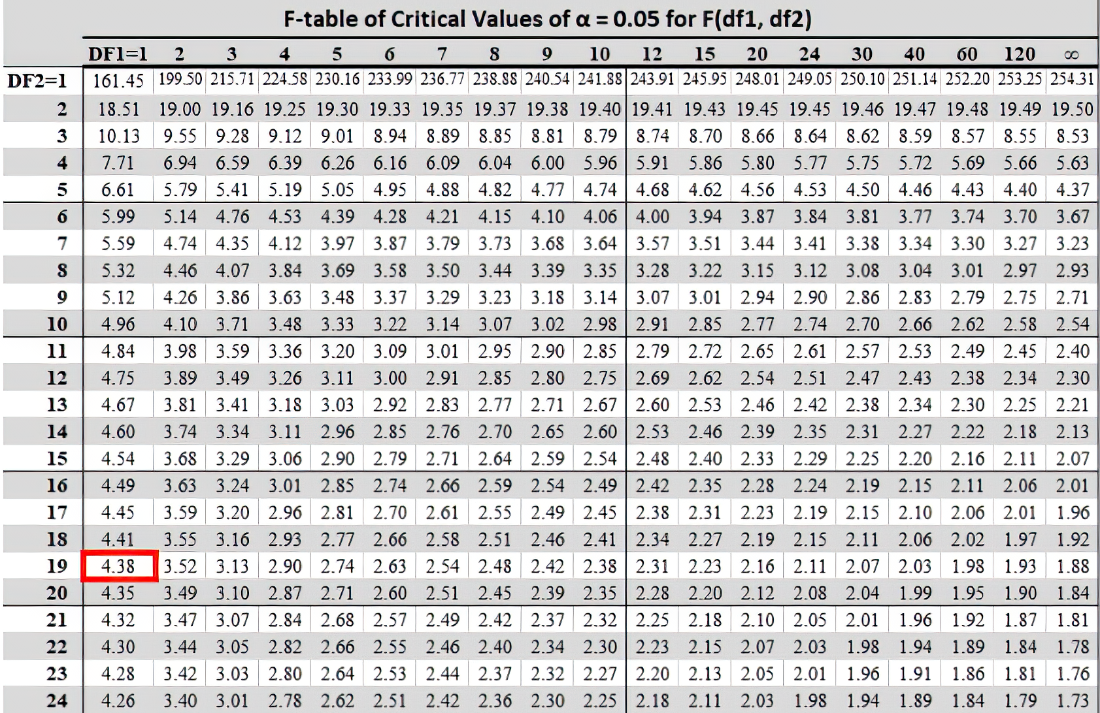
Use the F-table excerpt to connect significance level, predictor count, observation count, and the critical value. section 4.2.3

