The false-negative rate is the probability that an A/B test concludes a better version is not better. In deployment terms, the system stays on version A and misses an improvement offered by version B. It is commonly denoted β and conventionally limited to 20%, compared with a 5% false-positive limit. section 2.3.2
Use the rate to make sample-size decisions:
- Treat a false negative as an opportunity cost: it misses a beneficial change without directly degrading the running system. section 2.3.2
- Use power analysis to choose enough individual measurements for a practically significant difference to become statistically significant. section 2.3.2
Trading-system A/B test
Suppose version A uses ASDAQ and version B uses BYSE. Estimating variability and setting the practically significant difference to 1 produces 16 required individual measurements with the power-analysis design; fewer measurements increase the chance of missing a real improvement. section 2.3.2
Figure 2.10 (a) The shaded area to the left of the vertical line contains 5% of the histogram. (b) The shaded area to the left of the vertical line contains 5% of the right-hand histogram. The shaded area to the right of the vertical line contains 20% of the left-hand histogram. A/B test design sets the location of the vertical line, which in turn determines the number of individual measurements.
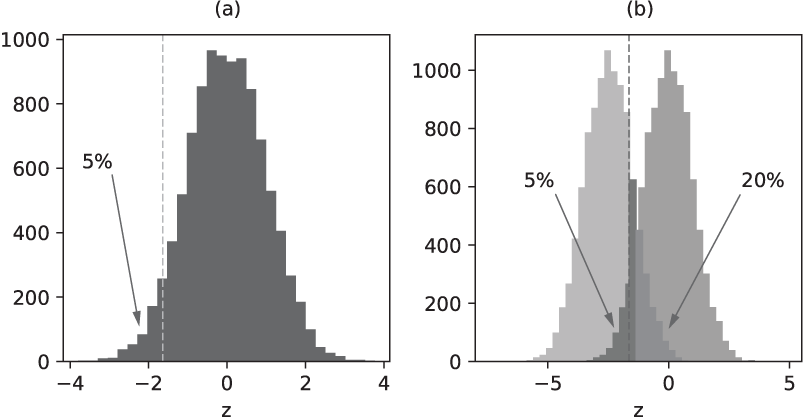
Visualizes how the decision threshold leaves 20% of the beneficial-change distribution in the false-negative region. section 2.3.2