A fishbone diagram organizes a problem and its potential causes: the problem sits at the head, a central spine leads toward it, and branches group causes into categories. In software investigations, it helps teams look beyond their first guess and consider causes across the system. section 8.2.2
Choose categories that fit the failure; they are prompts for a broad investigation, not fixed rules.
- For deployment failures, consider People, Process, Technology, and Environment. section 8.2.2
- For intermittent API errors, consider Code, Infrastructure, Dependencies, and Configuration. section 8.2.2
- Use any layout that branches causes by category; a tree, mind map, sticky notes, or boxes and arrows can serve the same purpose. section 8.2.2
Deployment failures in staging
When deployments fail in staging but pass locally, a team can check four categories. In one investigation, examining People, Process, Technology, and Environment moved attention away from the pipeline and toward the runtime. The value is in checking categories that seem unlikely, not in drawing a perfect fish. section 8.2.2
Figure 8.3 Applying the fishbone to a software deployment failure. Each branch records what was checked and by whom. Eliminating People, Process, and Environment narrows the cause.
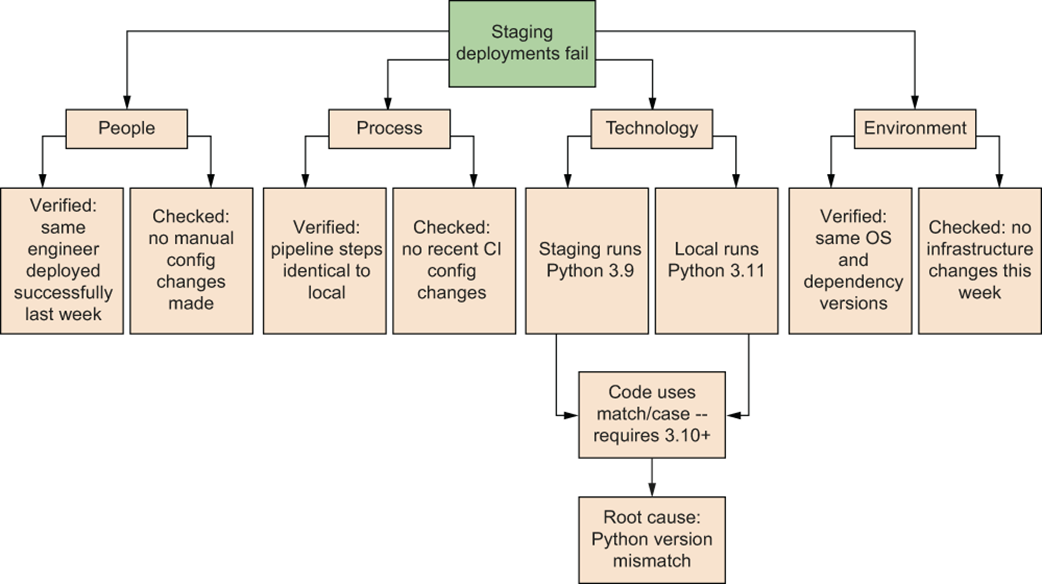
The diagram shows how recording checks across branches can narrow a deployment investigation. section 8.2.2
A fishbone can also complement other root-cause tools: use it to decide where to look, then use 5 Whys to trace a cause chain and Is/Is Not to narrow the failure boundary. section 8.2.5
