A flame graph visualizes where execution time accumulates across call stacks. Each bar is a function call: stacked bars show callers and callees, while width shows how long work ran. Read it by finding the widest bars, then tracing downward through the stack until the function or pattern causing the cost becomes clear. section 7.1.2 section 7.2.3
Capture a narrow, representative workload before drawing conclusions. For an interaction, record one action rather than general browsing; CPU throttling can expose main-thread work that a development machine hides. Long tasks and dense clusters of stacked work indicate responsiveness risks, especially when JavaScript runs longer than 50 ms. section 7.1.2
Use the graph as a diagnostic workflow:
- Locate the widest bar or repeated wide region; it marks the largest accumulated time cost. section 7.1.2 section 7.2.3
- Follow its stack to distinguish expensive local work from a caller whose time is spent in descendants. section 7.2.3
- Check whether the work runs unexpectedly often, blocks the main thread, or could move to background execution. section 7.4.2
- Escalate from function-level results to line-level profiling only after narrowing the slow function. section 7.2.3
A misleading expensive caller
A CPU profile reports serialize_response with 400 ms cumulative time but only 5 ms spent in the function itself. The remaining 395 ms belongs to functions it calls, so the flame graph or call tree should be followed deeper rather than treating serialization as the bottleneck. section 7.2.3
Figure 7.3 Layout thrashing in the Chrome DevTools flame chart. The alternating Recalculate Style and Layout blocks in purple show the browser being forced to recalculate layout repeatedly by a read-write loop in the JavaScript above in yellow. The red triangles flag each recalculation as a forced reflow.
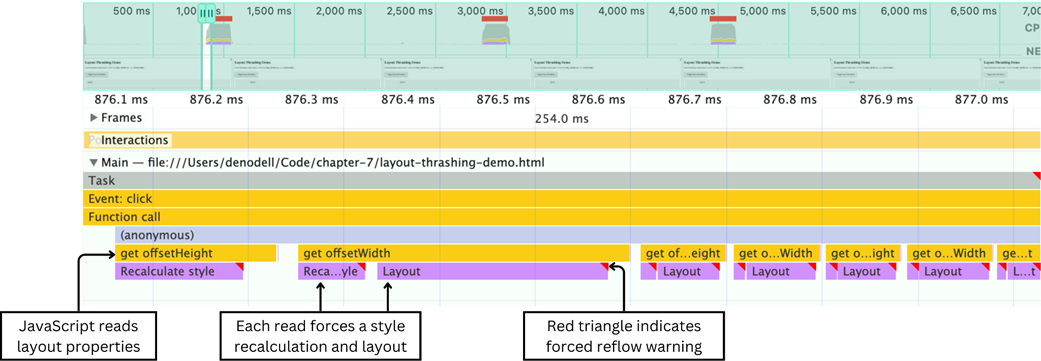
The alternating Recalculate Style and Layout blocks reveal repeated forced reflows caused by a JavaScript read-write loop, turning a wide visual region into an actionable layout-thrashing diagnosis. section 7.1.2