The Friedman test compares three or more related samples by ranking measurements within each participant. It is a non-parametric alternative to one-way repeated-measures ANOVA when normality or sphericity assumptions are violated. It can be used with continuous or ordinal data. section 5.2.1 section 5.4
The key design question is whether measurements are related. Use the Friedman test for three or more dependent samples, such as repeated measurements from the same participants. For independent samples, the corresponding rank-based option is the Kruskal–Wallis test; for two dependent samples, it is the Wilcoxon signed-rank test. section 5.2.1 section 5.4
The test produces a Q-statistic from ranks assigned within participants and combined across groups. A Q-statistic above the critical threshold supports rejecting the null hypothesis, but does not by itself identify which samples differ. Follow-up comparisons can locate differences; a Bonferroni correction lowers the significance threshold to account for multiple comparisons and their increased false-positive risk. section 5.2.1 section 5.4
Choose the comparison plan before examining results, and report non-significant findings as well as significant ones. This keeps the statistical choice tied to the measurement design rather than to a preferred outcome. section 5.4
Figure 5.10 Steps to calculating the Q-statistic
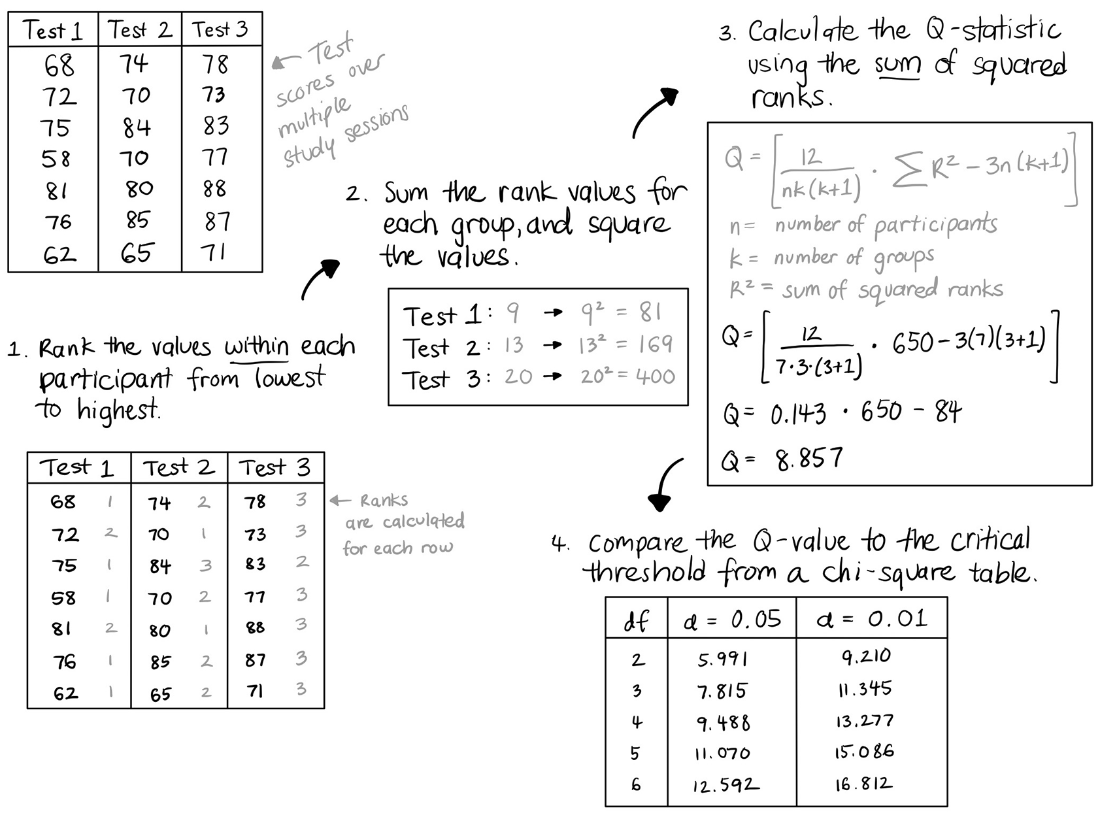
A step-by-step figure traces how within-participant ranks contribute to the Q-statistic. section 5.2.1
