Frontend load time measures how long a page or application takes to load enough content for use. It matters because slower pages can reduce engagement, increase abandonment, weaken search visibility, and lower conversion. section 2.2.1 section 1.2.1
Measure loading behavior under realistic conditions rather than relying on fast development WiFi. A browser network panel exposes request order, transfer size, resource size, and download duration; throttling and disabled cache approximate a first-time visitor on a slower mobile connection. section 7.1.1
Diagnosing an oversized article page
An article template appears to load in under a second on fast WiFi, but Slow 4G throttling reveals 723 kB transferred, 1.9 MB of uncompressed resources, and a 500 kB budget exceeded by nearly half. Sorting the waterfall by size exposes large resources, while synchronous scripts in the head help explain delayed rendering. section 7.1.1
Figure 2.1 An example Core Web Vitals report in Google Search Console.
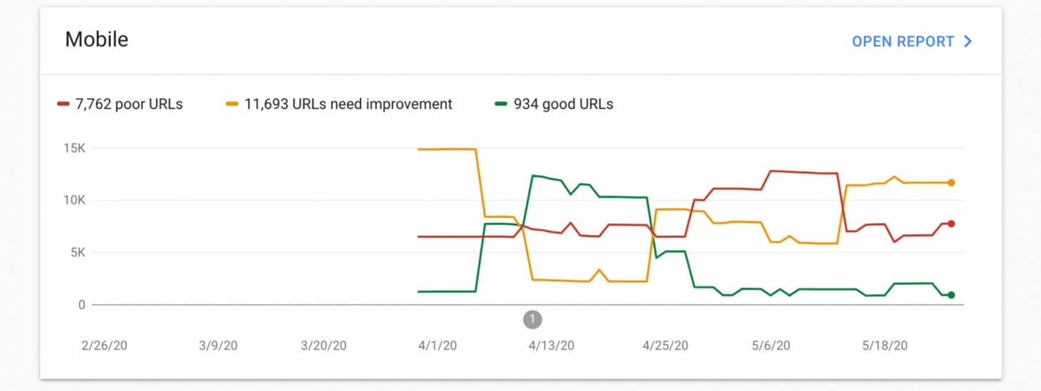
Use a Core Web Vitals report to inspect how loading and related user-facing performance signals appear in Google Search Console. section 2.2.1