Future-proofing means designing a visualization with anticipated data growth in mind. Reserve space for sparse data to fill in, but avoid expensive preparation for every imaginable edge case: prevent problems when prevention is clearly cheaper than repair. section 9.1.1
Practical ways to future-proof a visualization include:
- Leave room for every category in a table or bar chart. section 9.1.1
- Allow a meaningful span of time to appear as a trend develops. section 9.1.1
- Preserve readability as bars multiply by suppressing some labels instead of overcrowding the axis. section 9.1.1
- Make missing days, weeks, or months visible rather than smoothing over the holes. section 9.1.1
A trend with missing points
A line chart becomes easier to read when each available data point gets a dot and the line breaks where data is missing. The empty spaces then communicate absence instead of quietly implying continuity. section 9.1.1
Figure 9.1 When trending data in a line chart, I like to make it more obvious where the data points are by adding a dot at each point. Not only is it easier to understand, but it’s also more apparent when there’s data missing. Breaking the line on missing data points further drives the point home.
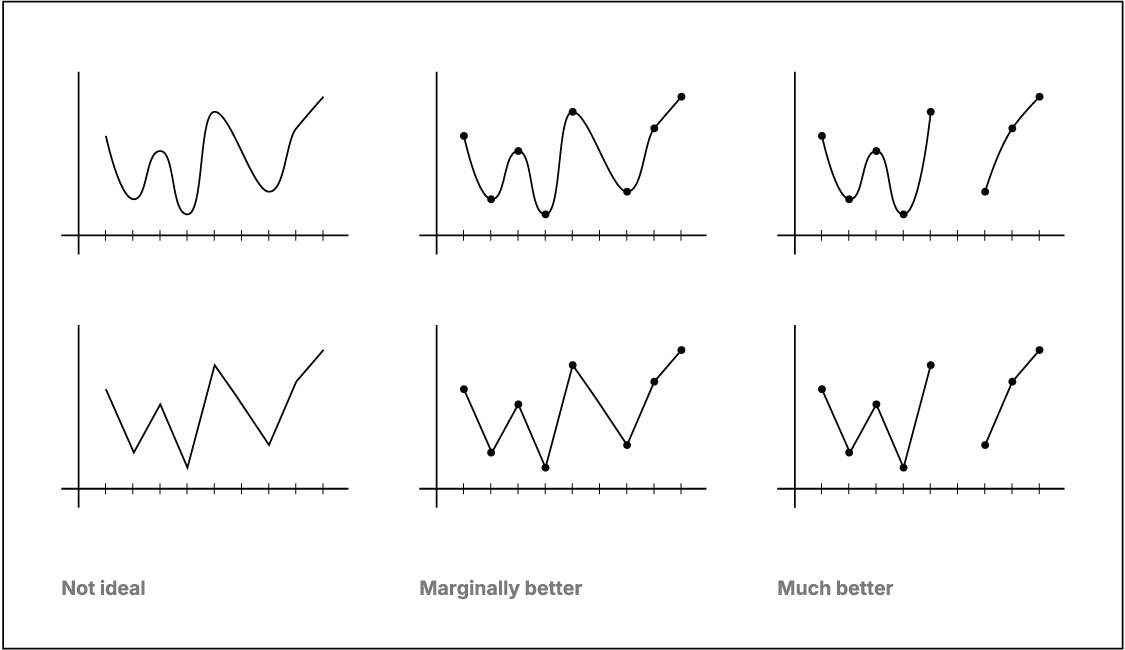
Use the figure to compare a continuous-looking trend with one that makes individual observations and missing points explicit. section 9.1.1
