A gauge is a numeric metric for a value that can rise or fall, such as active requests, current memory use, or another changing quantity. Your application or its developers choose when to update it; Prometheus and the client library handle collection. section 9.2 section 9.4
Use a gauge when the metric represents a current level rather than an accumulated total:
- Declare a gauge with a descriptive name and help text. section 9.2
- Set its value when the application observes the current quantity. section 9.2
- Expose the application’s /metrics endpoint and inspect the collected value. section 9.2
- Query and visualize the gauge to follow operational trends; sudden changes matter more than an isolated value. section 9.4
Tracking current unique IP addresses
A Node.js application can declare an access_client_ip_current gauge and update it with the current count: clientIpGauge.set(countOfIpAddresses). This differs from an access_log_total counter, which only increases. section 9.2
Figure 9.13 A closer look at the application dashboard and how visualizations relate to the golden signals
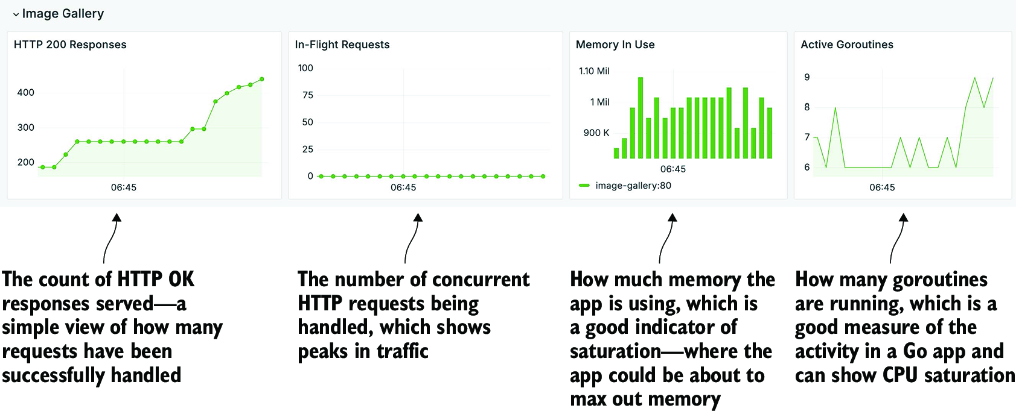
Inspect how a Grafana application dashboard connects gauge visualizations with operational signals such as in-flight requests. section 9.4

