A genealogy plot visualizes how individuals connect across generations during evolutionary optimization. Each circle represents a generation, while arrows mark offspring relationships and connected evolutionary steps. section 3.4
Use the graph to inspect whether genetic operators are producing viable progress:
- Many arrows and connections suggest that offspring remain viable and that evolution is progressing from less fit toward more fit individuals. section 3.4
- Few or absent connections suggest that crossover is failing to produce viable offspring. section 3.4
- Isolated points may represent random offspring with good fitness but no viable descendants. section 3.4
Comparing crossover operators
Set the destination count to 10, reduce the population and generations to 5, generate the plot during evolution, and rerun the notebook after changing crossover operators. Small populations keep rendering manageable and the resulting plots support operator comparison. section 3.4
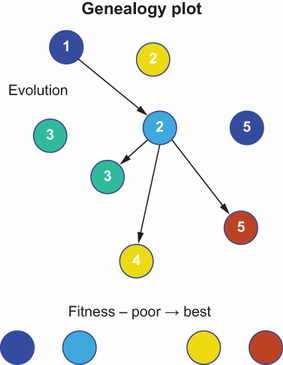
Inspect the illustrated flow of individuals evolving through crossover. section 3.4
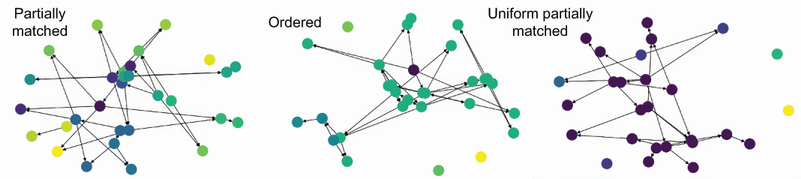
Compare genealogy patterns produced by different crossover operations. section 3.4
