Graph visualization represents entities as nodes and their connections as relationships, making connectivity and structural patterns easier to see than in isolated tables or documents. It supports intuitive exploration of complex, highly connected data. section 1.0 section 1.3
A useful graph visualization workflow:
- Model records and metadata as nodes, then connect related entities with relationships. section 1.0
- Traverse connections to find related records instead of inspecting each record independently. section 1.0
- Use graph algorithms before visualizing very large networks, then inspect communities, influential nodes, or other focused subgraphs. section 1.1 section 1.3
Exploring a Twitter network
In Neo4j Browser, inspect a sample of FOLLOWS relationships with `MATCH p=()-[r:FOLLOWS]->() RETURN p LIMIT 25;`. The returned path produces a graph visualization of connected users. Change the relationship type to RETWEETS as an exercise. section 4.1
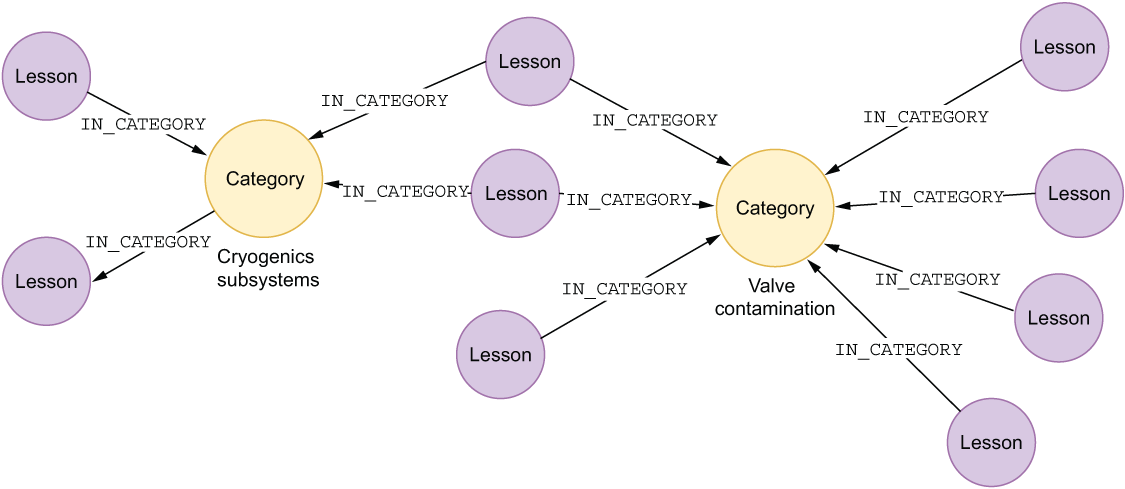
Use the connected-lessons figure to see how traversing from a category to lesson nodes reveals relevant information. section 1.0
