The input-output framework organizes an offline evaluation around the data it uses, the design that determines how it runs, and the metrics and insights it produces. It helps connect an evaluation’s setup to the questions it needs to answer before a model reaches users. section 2.2 section 3.1.1
Plan the evaluation in three parts:
- Input: Gather the data needed for the question, such as historical interactions, ground-truth labels, and contextual metadata. section 2.2
- Design: Choose metrics and test scenarios, and define the sampling strategy and confidence estimation. Structure the evaluation around the model’s objectives. section 2.2
- Output: Produce metrics and diagnostic insights, such as precision, recall, coverage, bias indicators, or robustness checks. Use them to identify weaknesses and guide changes. section 2.2
Figure 3.1 illustrates the input-output framework for diagnostic offline evaluations, showcasing how data, design, and metrics work together to identify potential issues in machine learning models. The input consists of data, such as historical interactions, user metadata, and labeled outcomes, which provide the foundation for the evaluation. The design process defines how this data is analyzed, using tools like subgroup analysis or visualization techniques, to produce actionable metrics like fairness scores or bias indicators as the output.
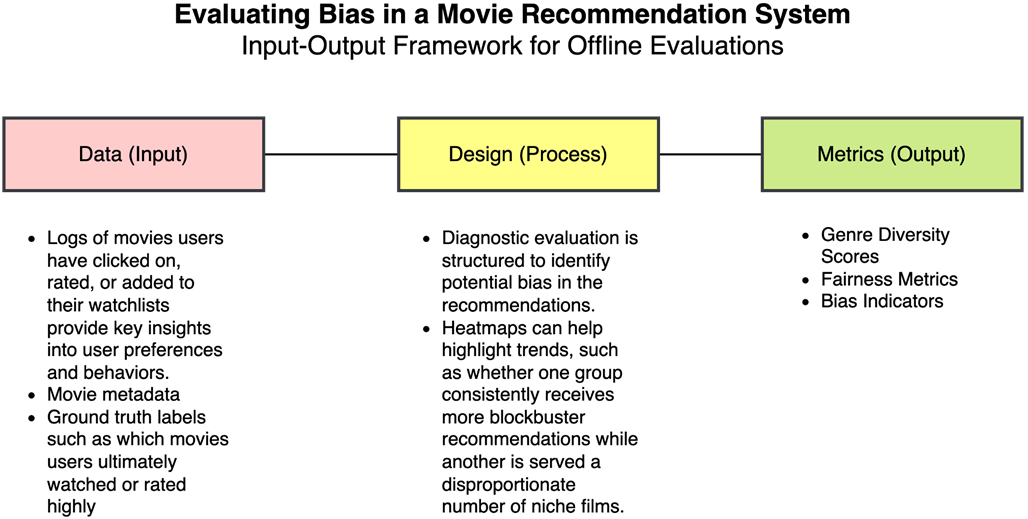
The diagram traces diagnostic data through analysis to metrics such as fairness scores and bias indicators. section 3.1.1
Diagnosing movie recommendation exposure
Use recommendation outputs, user attributes, and movie metadata as inputs. Group recommendations by user segment and genre, then normalize each segment’s counts to compare exposure proportions. A table or heatmap can reveal whether some groups receive narrower selections. Historical behavior can help construct realistic profiles; watched or highly rated movies help compare exposure with relevance or preference. Differences between groups are signals to investigate, not automatic evidence of a problem. section 3.1.1
Listing 3.1 Analyzing Distribution of Genres by Age Group Cohorts
# Calculate the distribution of genres within each age group's recommendations
genre_diversity = analysis_df.groupby(['age_group', 'genre']).size().reset_index(name='count')
genre_pivot = genre_diversity.pivot(index='age_group', columns='genre', values='count').fillna(0)
genre_pivot = genre_pivot.div(genre_pivot.sum(axis=1), axis=0)  # Normalize by row to get proportions

genre_pivot
This listing groups recommendations by age and genre, pivots the counts, and normalizes each row into proportions. section 3.1.1
