Intra-cluster distance measures cluster cohesion: it is the average pairwise distance between points assigned to the same cluster. Lower values indicate points that are closer together. Unlike distance to centroids, it does not require a centroid-based clustering algorithm, so it can also assess methods such as DBSCAN and OPTICS. section 12.5
Use the metric to:
- Compare candidate clusterings by measuring how compact their groups are. section 12.5
- Plot metric values across candidate hyper-parameters and look for an elbow, where additional improvement becomes small. section 12.5
- Interpret the result alongside inter-cluster distance or total cohesion rather than treating one metric as a complete assessment. section 12.6
Choosing a cluster count
Evaluate customer clusterings for several values of k, record the intra-cluster average distance, and select the elbow. In the illustrated dataset, k=6 is preferred because later additions produce little improvement. section 12.5
Figure 12.25 The elbow method used to determine the best value for the number of clusters into which the dataset in figure 12.24 should be split. You can guess where the name comes from.
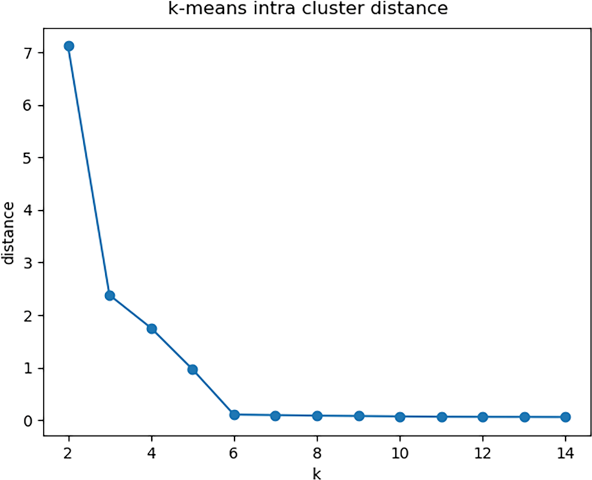
The figure shows how plotting intra-cluster average distance helps identify an elbow and choose the number of clusters. section 12.5
Listing 12.10 The elbow method
function kmeansElbow(points, ksToTest, maxIter, runsPerK)        #1
  results ← {}                                                   #2
  for k in ksToTest do                                           #3
    M ← []                                                       #4
    for i in {1,..,runsPerK} do                                  #5
      (centroids, clusters) ← kmeans(points, k, maxIter)         #6
      M[i] ← intraClusterDistance(points, centroids, clusters)   #7
    results[k] ← min(M)                                          #8
  return results                                                 #9
The pseudocode evaluates several k values, repeats clustering runs, computes intra-cluster distance, and retains the best result for each k. section 12.5
