IR inspection reveals how a Triton kernel is lowered toward GPU code. Use it to investigate performance problems, surprising behavior, or memory access, tiling, and control flow; routine kernels usually need no inspection. section 2.3.2
After a kernel’s first invocation, inspect the compilation stages:
- Retrieve representations from the compiled kernel’s asm dictionary, which maps stage names such as ttir, ptx, and cubin to source strings. section 2.3.2
- Trace Triton IR through Triton GPU IR and LLVM IR to PTX assembly and the final binary. section 2.3.2
- Use Compiler Explorer to view generated PTX and select other compilation stages as code changes. section 2.3.2
Listing 2.3 Code for Compilation stages
import torch
import triton
import triton.language as tl

@triton.jit
def add_kernel(x_ptr, y_ptr, z_ptr, n_elements, BLOCK_SIZE: tl.constexpr):
    pid = tl.program_id(0)
    offsets = pid * BLOCK_SIZE + tl.arange(0, BLOCK_SIZE)
    mask = offsets < n_elements
    x = tl.load(x_ptr + offsets, mask=mask)
    y = tl.load(y_ptr + offsets, mask=mask)
    tl.store(z_ptr + offsets, x + y, mask=mask)

x = torch.rand(1024, device="cuda")
y = torch.rand(1024, device="cuda")
out = torch.empty_like(x)
compiled = add_kernel[(1,)](x, y, out, 1024, BLOCK_SIZE=1024)

with open("ttir.md", "w") as f:
    f.write(compiled.asm["ttir"])

with open("ttgir.md", "w") as f:
    f.write(compiled.asm["ttgir"])

with open("llir.md", "w") as f:
    f.write(compiled.asm["llir"])

with open("ptx.md", "w") as f:
    f.write(compiled.asm["ptx"])
See a vector-add kernel compiled once, then write its intermediate representations to files through the compiled kernel’s asm attribute. section 2.3.2
Figure 2.12 Compiler Explorer interface. The basic layout of Godbolt shows a Triton kernel on the left and the generated output on the right. The editor compiles the code automatically as you make changes, and the stage selector lets you examine each part of the pipeline.
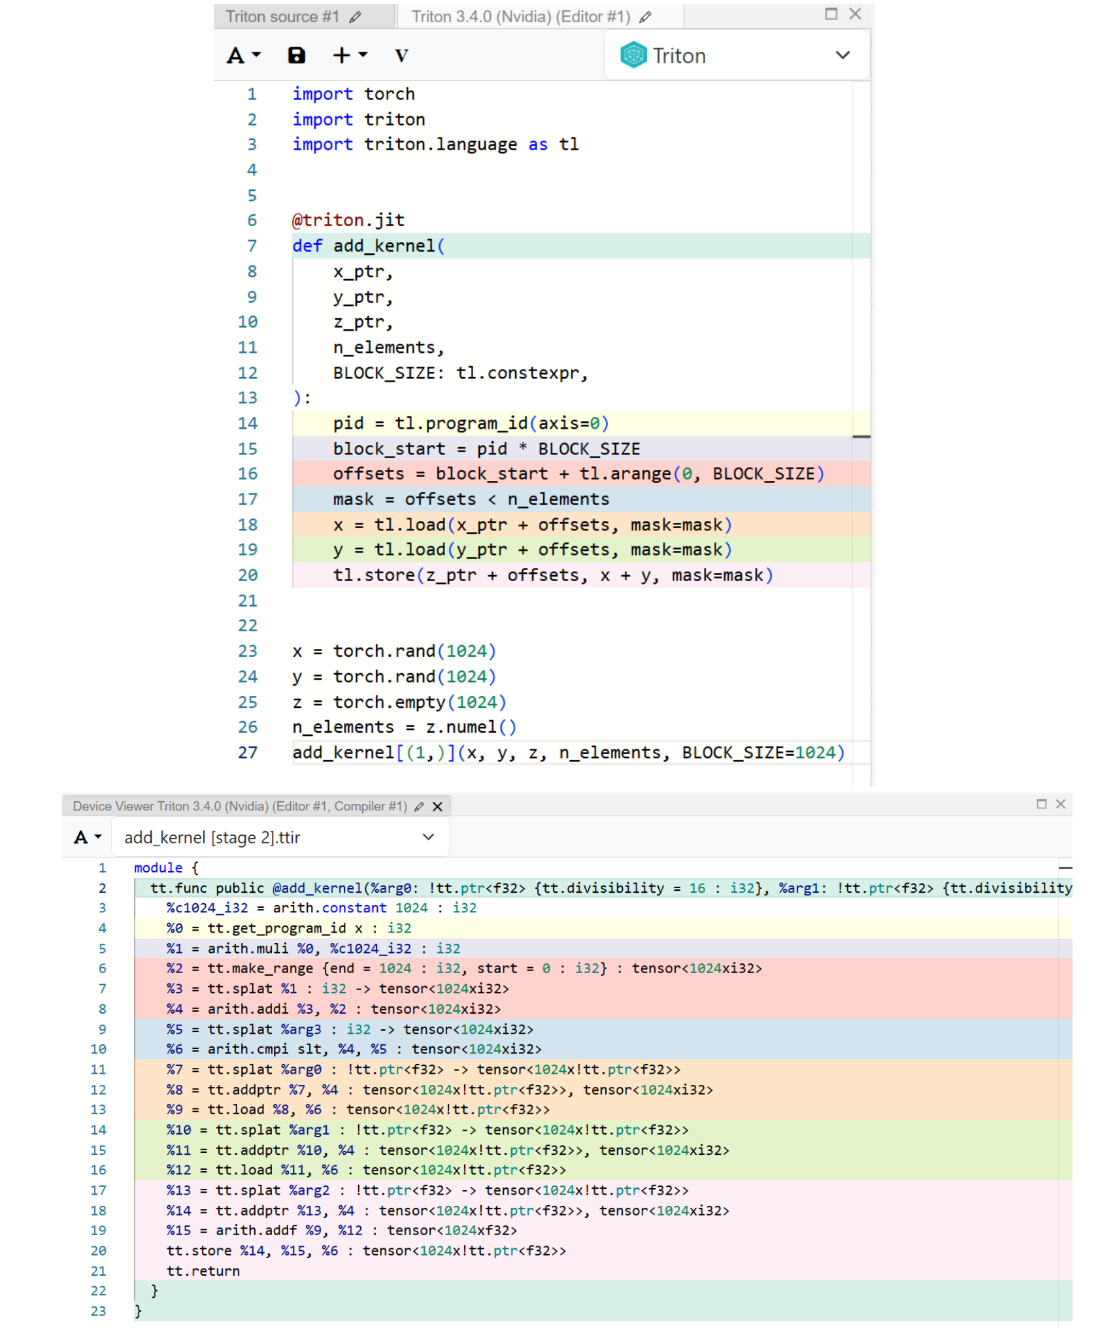
Compare a Triton kernel with its generated output in Compiler Explorer and switch between stages. section 2.3.2