Jaccard similarity measures how much two sets overlap. Divide the number of shared members (the intersection) by the number of distinct members across both sets (the union). Scores range from 0 to 1: 0 means no shared members, and 1 means the sets contain exactly the same members. section 7.2.1
Comparing shopping baskets
If basket A contains a couch, speakers, phone, and TV, and basket B contains a phone, TV, and headphones, their intersection has 2 products and their union has 5. Their Jaccard similarity is 2 / 5 = 0.4. section 7.2.1
In a graph, use Jaccard similarity to turn shared neighbors into weighted similarity relationships. For example, compare tags by the tweets that use them, then infer a co-occurrence network whose relationship score represents tag overlap. This projection makes a bipartite network more suitable for analysis such as community detection or PageRank. section 7.0 section 7.2.2
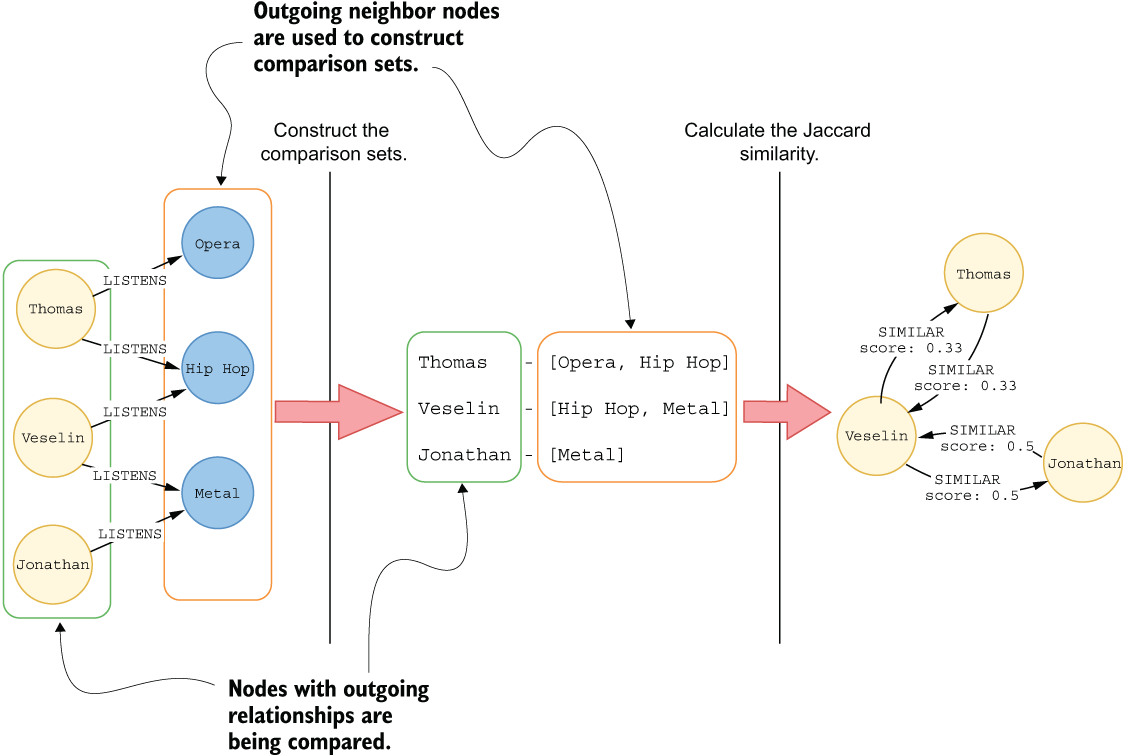
The diagram shows the comparison sets used by node similarity: nodes are compared through their neighbors, and overlap becomes a similarity score. section 7.2.2
To calculate Jaccard similarity for graph nodes with Neo4j Graph Data Science (GDS):
- Choose which nodes to compare and which neighboring nodes form each comparison set. In a user-to-genre graph, users can be compared by the genres they listen to. section 7.2.2
- Check relationship direction. To compare tags by their tweets, reverse Tweet-to-Tag HAS_TAG relationships during in-memory graph projection rather than changing the stored graph. section 7.2.2
- Run gds.nodeSimilarity.stats with similarityMetric: 'JACCARD' to inspect the number and distribution of similarity pairs before creating relationships. section 7.2.2
- Use similarityCutoff to retain only scores at or above a threshold, and use topK to limit similar relationships retained per node when constructing the inferred network. section 7.2.2 section 7.7
- Use mutate mode to write CO_OCCURRENCE relationships and their score property into the in-memory graph for later graph analysis. section 7.2.2
Raw co-occurrence counts can be useful relationship weights, but Jaccard similarity normalizes overlap by the total distinct members in both sets. That makes it a direct similarity metric for judging whether two nodes share a large enough portion of their neighborhoods to be treated as related. section 7.2.1 section 7.7
