liveBook · Manning

JVM

As explained in Cloud Observability in Action

The Java virtual machine is the runtime environment that executes Java bytecode and manages resources such as memory and threads.

The Java virtual machine (JVM) is a language-specific virtual machine and a rich observability signal source for Java workloads. It exposes logs and metrics such as heap-memory usage and thread activity, with multiple tools available for monitoring performance. section 3.2.1

JVM monitoring can draw on:

  • Logs, including Java logging output. section 3.2.1
  • Metrics covering heap memory usage and threads. section 3.2.1
  • Performance-monitoring tools selected for the JVM workload and operating context. section 3.2.1
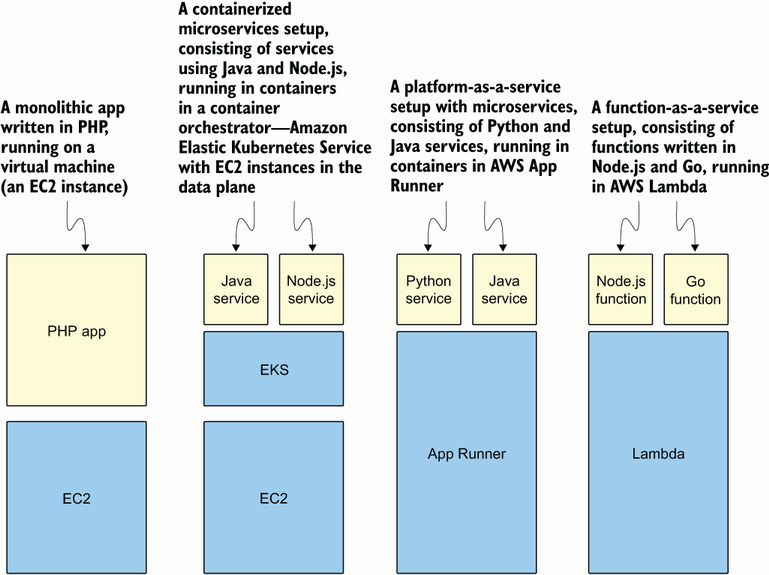
Figure 3.1 A spectrum of compute, infrastructure, and application level

Place the JVM on the spectrum between infrastructure-level and application-level observability sources. section 3.2.1

How Cloud Observability in Action covers it

How deep it goes
Identifies JVM signals and monitoring options but does not explain JVM internals or individual monitoring tools.
Examples
Uses heap-memory usage, thread activity, JVM logs, and performance-monitoring tools as concrete signal examples.
What you can do after
Evaluate JVM observability by distinguishing its logs, metrics, and performance-monitoring signals.
How it connects
Connects the JVM with virtual machines, logs, metrics, heap memory, threads, and observability.

Related concepts

This explainer was generated by Manning's knowledge graph from the text of Cloud Observability in Action. The section links point to the parts of the book it draws on.