Known-question analysis starts with predefined questions, then translates each question into explicit computations, outputs, and visualizations. This reduces ambiguity when an LLM generates analytical code. section 4.3.1
A practical specification identifies:
- The required dataset path and filename, preventing generated notebooks from searching the wrong directory. section 4.3.1
- The grouping, ranking, aggregations, percentages, tables, and charts needed to answer each question. section 4.3.1
- Export requirements such as an images directory and high-resolution PNG output. section 4.3.1
Pharmaceutical market analysis
A defined analysis ranks the ten manufacturers with the most products, compares their average prices, measures discontinued products and their percentage, and summarizes count and average price by medicine type. section 4.3.1
Figure 4.3 Top 10 drug manufacturers ranked by number of products sold, with each manufacturer’s average drug price shown alongside.
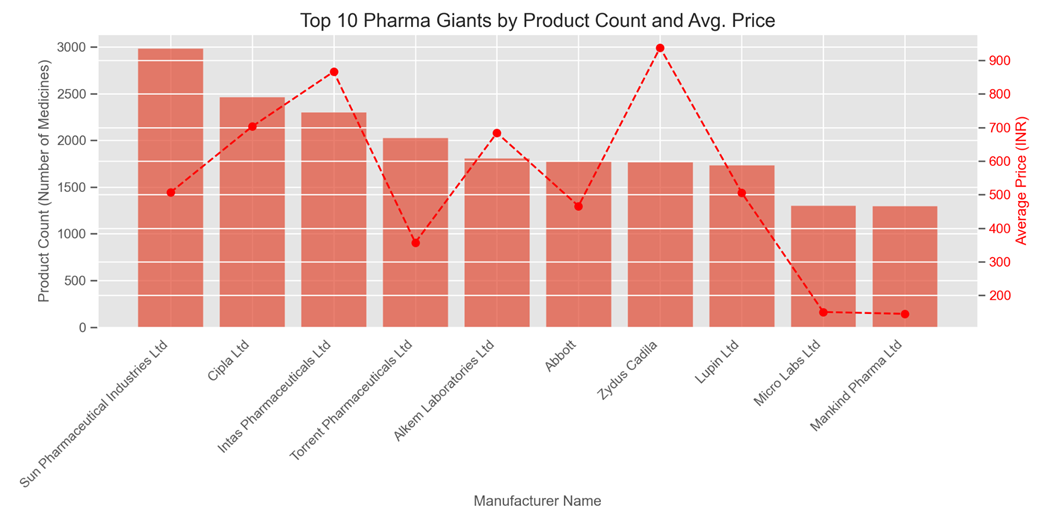
Compare manufacturer product counts with average prices in a dual-axis visualization. section 4.3.1
Listing 4.2 The Jupyter analysis output
--- Medicine Type Analysis Summary ---
            Count  Average Price (INR)
type
allopathy  253973           270.530844
Inspect the generated summary table combining medicine-type counts and average prices. section 4.3.1
