Latency variance is the variation in delay across comparable operations. Each delay runs from a cause to its observed effect, so measurement starts by choosing those two events consistently. A single reported latency, such as an average response time, can hide how much individual requests differ. section 1.1 section 2.2
A light that does not respond immediately
For a smartphone-controlled light, measure from pressing “on” in the app to seeing the bulb turn on. The command travels through a wireless network to a hub and then through another connection to the bulb. Repeating that measurement reveals whether the delay is consistent, not just how long one attempt took. section 1.1
To assess variability in a latency-sensitive system:
- Collect latencies across requests and examine their distribution rather than reporting only an average. section 2.2
- Report high percentiles such as the 95th, 99th, or 99.9th percentile to expose tail latency. A minimum and maximum show only the extremes. section 2.2
- Compare results under relevant workloads: system state, queuing, and algorithmic complexity can change latency as throughput increases. section 2.2
Figure 2.5 Tail latency illustrated. The diagram shows the probability of service latency being more than 1 second (y axis) as a function of parallel fanout count (x axis) depending on the probability of one fanout request being slow.
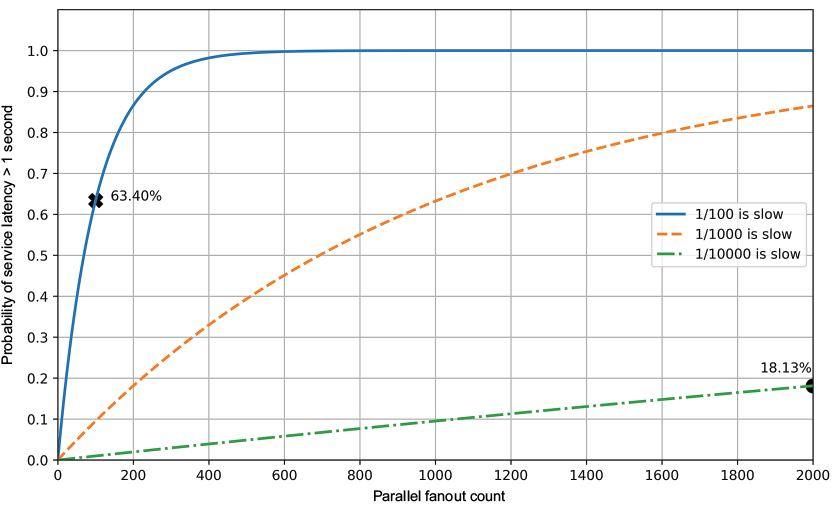
The fanout figure shows why a small chance of one slow request matters: as a service makes more parallel requests, its chance of exceeding a latency threshold can rise. section 2.2
