Manufacturer analysis examines medicine records to identify which companies produce the most medicines. A practical workflow turns that question into a reproducible Jupyter Notebook analysis. section 4.3
A focused manufacturer analysis can:
- Rank the top 10 manufacturers by product count. section 4.3.1
- Compare each leading manufacturer's product count with its average drug price using a dual-axis chart. section 4.3.1
- Extend the analysis with discontinued-product statistics and medicine-type counts and prices. section 4.3.1
- Save generated plots as high-resolution PNG files for later reuse. section 4.3.1
Indian medicine dataset
Using data/updated_indian_medicine_data.csv, generate a notebook that ranks manufacturers by product count, displays average prices for the top 10, and records the resulting charts and tables. section 4.3 section 4.3.1
Figure 4.2 The jupyter notebook showing the analysis of drugs and the top manufacturers' results.
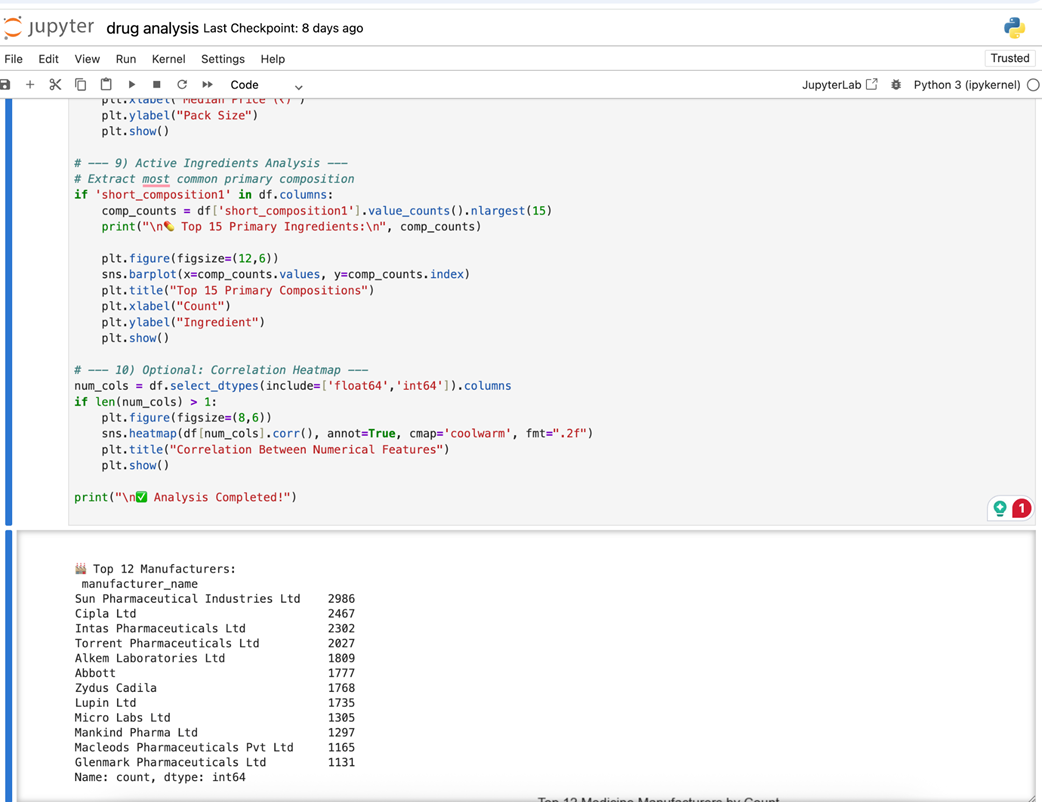
Use the notebook view to inspect the manufacturer ranking and the analysis output that supports it. section 4.3
Figure 4.3 Top 10 drug manufacturers ranked by number of products sold, with each manufacturer’s average drug price shown alongside.
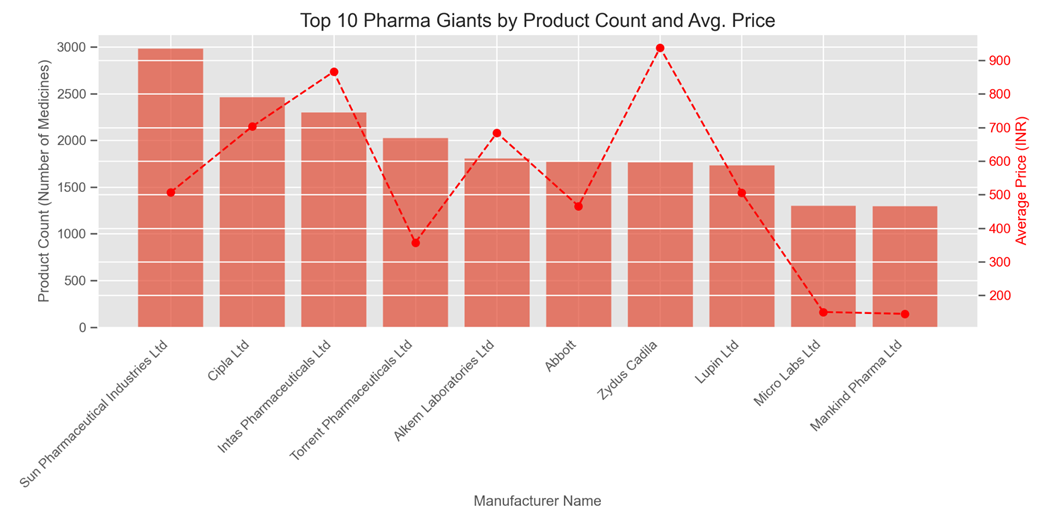
Use the combined chart to compare product counts and average prices across the ten leading manufacturers. section 4.3.1
