liveBook · Manning

Leverage

As explained in Machine Learning System Design

Leverage is a measure of how much an observation's predictor values can influence fitted regression coefficients.

Leverage measures how much a regression model’s fitted coefficients would change if a particular observation were removed. It helps flag observations that may disproportionately influence results. section 9.2.2

Use leverage as part of residual analysis:

  • Inspect a residuals-versus-leverage plot to identify potentially influential cases. section 9.2.2
  • Treat extreme observations as candidates for further investigation rather than automatically removing them. section 9.2.2
  • Use Cook’s Distance as a commonly used measurement for influential data points. section 9.2.2
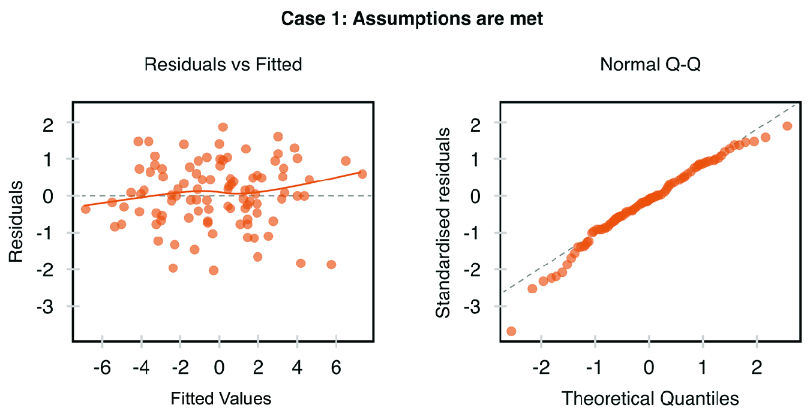
Figure 9.10 Four diagnostic plots for linear regression’s residual analysis in both cases (Case 1: Assumptions are met)
figure

Compare the residual-diagnostic plots to see how leverage fits alongside other regression assumption checks. section 9.2.2

How Machine Learning System Design covers it

How deep it goes
Defines leverage operationally and pairs it with diagnostic plots and Cook’s Distance, without deriving its mathematics.
Examples
Uses residuals-versus-leverage plots and observation-removal comparisons to examine influential cases.
What you can do after
Diagnose potentially influential regression observations with residuals-versus-leverage plots and Cook’s Distance.
How it connects
Connects leverage to linear regression, residual analysis, influential cases, homoscedasticity, and Cook’s Distance.

This explainer was generated by Manning's knowledge graph from the text of Machine Learning System Design. The section links point to the parts of the book it draws on.