Lift measures the change in a key outcome for a treatment group relative to a control or baseline. In an A/B experiment, it is the relative difference between groups and the central effect to monitor. section 12.3.2 section 12.3.4
Use lift as part of an experiment workflow:
- Estimate expected uplift from prior experience, benchmarks, rules of thumb, or offline testing before defining the experiment. section 12.2.1
- Set the minimum detectable effect no higher than the expected uplift, then account for error thresholds, variation, sample size, and duration. section 12.2.1
- Monitor cumulative lift over time, but avoid repeated unplanned peeking; use a prespecified period or sequential-testing framework. section 12.3.2
- Report point, pessimistic, and optimistic effect estimates using the point difference and confidence bounds, then examine segments and rollout implications. section 12.3.4
Reading a lift result
A report can show CVR of 75.2% for group A and 79.8% for group B, with 6.12% lift and p-value 0.0472; its conclusion reports a significant +4.2–6.9% effect. AOV shows 4.57% lift but p-value 0.3704, so the report concludes there is no significant effect. section 12.3.4
Figure 12.9 An example of cumulative lift dynamics over time with specific confidence intervals
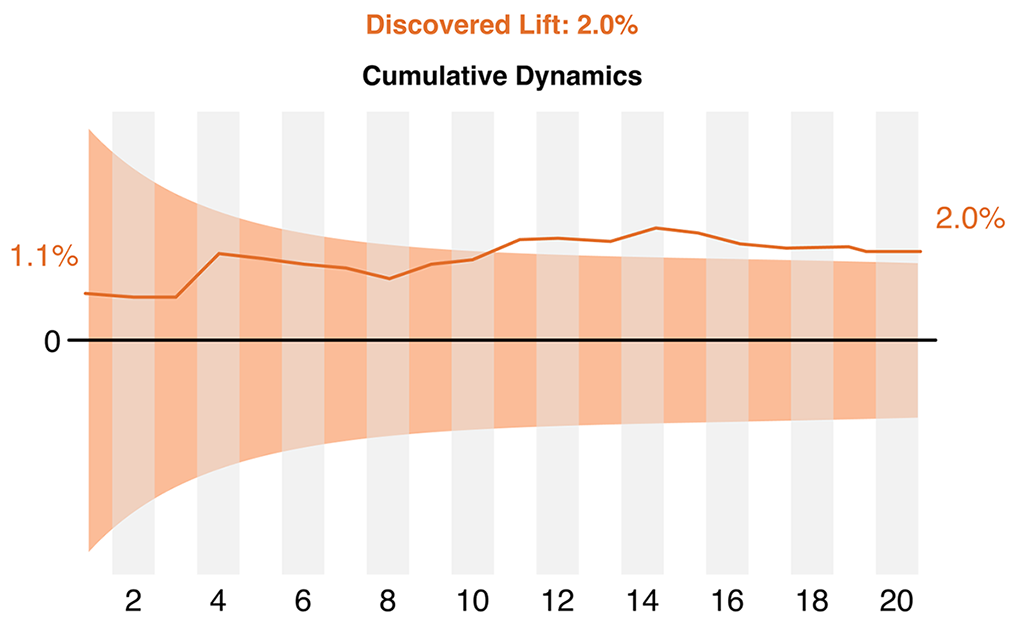
A cumulative-lift chart with confidence intervals helps track how the observed effect changes over experiment time and when it leaves the undetectable range. section 12.3.2

