A limitations section states which data were unavailable, how far findings can be interpreted, and which conclusions the evidence cannot support. section 2.2.1
Use it to make analytical boundaries visible to stakeholders:
- List unavailable data that prevents in-depth analysis. section 2.2.1
- State the scope of interpretation and avoid unsupported interpretations. section 2.2.1
- Add further-research recommendations that create a roadmap for future evaluation and investment. section 2.2.1
- Give stakeholders guidance on correlation, causation, statistical significance, and generalizing findings. section 2.2.1
Stakeholder presentation addendum
A team adds a slide to an existing report and presentation to clarify the project’s scope and the boundaries of its findings. section 2.2.1
A slide such as this delineates the scope of interpretation and helps ensure the long-term success of your work.
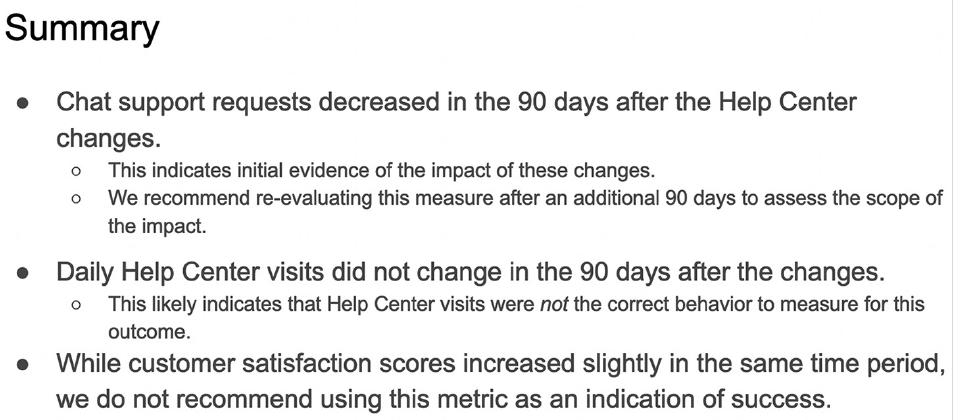
Use the slide figure to communicate the scope of interpretation and reinforce responsible stakeholder use. section 2.2.1
