A log transformation changes each nonnegative count y to log(1 + y). Adding 1 keeps zero counts defined while reshaping a right-skewed distribution. section 7.4.1
For the Bike Sharing data, casual-user counts range from 0 to 367 and contain many zeros with a long right tail. Comparing histograms before and after transformation helps reveal suitable modeling assumptions. section 7.4.1
The transformed target suggests two modeling directions:
- Use a Tweedie distribution when zeros and right-skewed positive values resemble a compound Poisson-gamma pattern. section 7.4.1
- Use a log-link function in a generalized linear model, or extend that intuition through supported ensemble methods. section 7.4.1
Bike Sharing counts
Inspect the casual-user histogram, transform every target with log(1 + y), and compare the resulting shape before selecting a distribution or link function. section 7.4.1
Figure 7.13 Histogram of count-valued targets, the number of casual users (left); histogram of the count targets after log transformation (right)
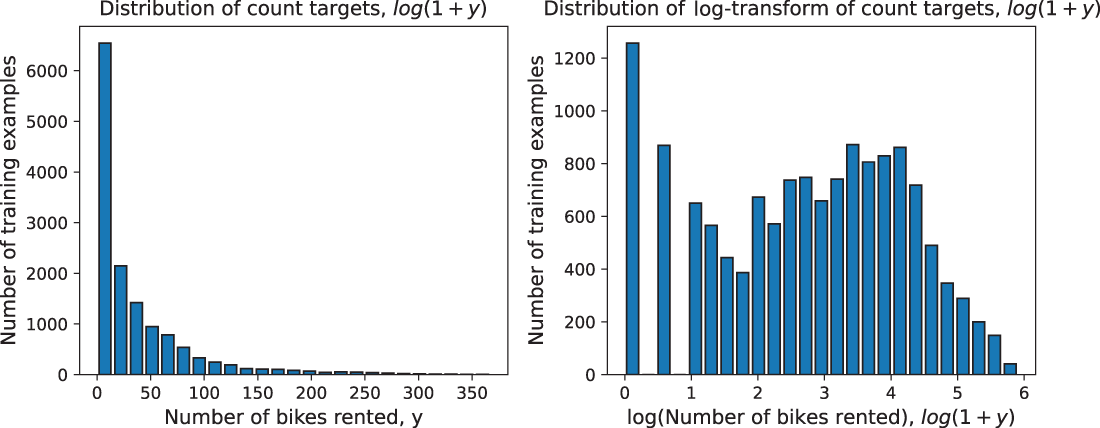
Compare the original count histogram with the histogram after log transformation. section 7.4.1

