liveBook · Manning

logS

As explained in Build AI Drug Discovery Pipelines

logS is the base-ten logarithm of a compound's molar solubility, with each unit representing a tenfold change in solubility.

logS measures aqueous solubility as the base-ten logarithm of molar solubility. Increasing logS by one means tenfold greater solubility. section 4.1.2

Use logS to interpret solubility and prepare prediction data:

  • Values around -6 to -3 correspond approximately to 1 μM to 1 mM, a common window for drug-like compounds. section 4.1.2
  • Values below -6 indicate poor solubility and can signal bioavailability challenges. section 4.1.2
  • Inspect extreme values before modeling: the dataset spans -12 to 1.97, and outliers may impair learning. section 4.1.2
  • Flag candidates statistically with the IQR rule or remove implausible compounds using chemical domain knowledge. section 4.1.2
Figure 4.1 Comparison of solubility distributions for train and validation data sets.
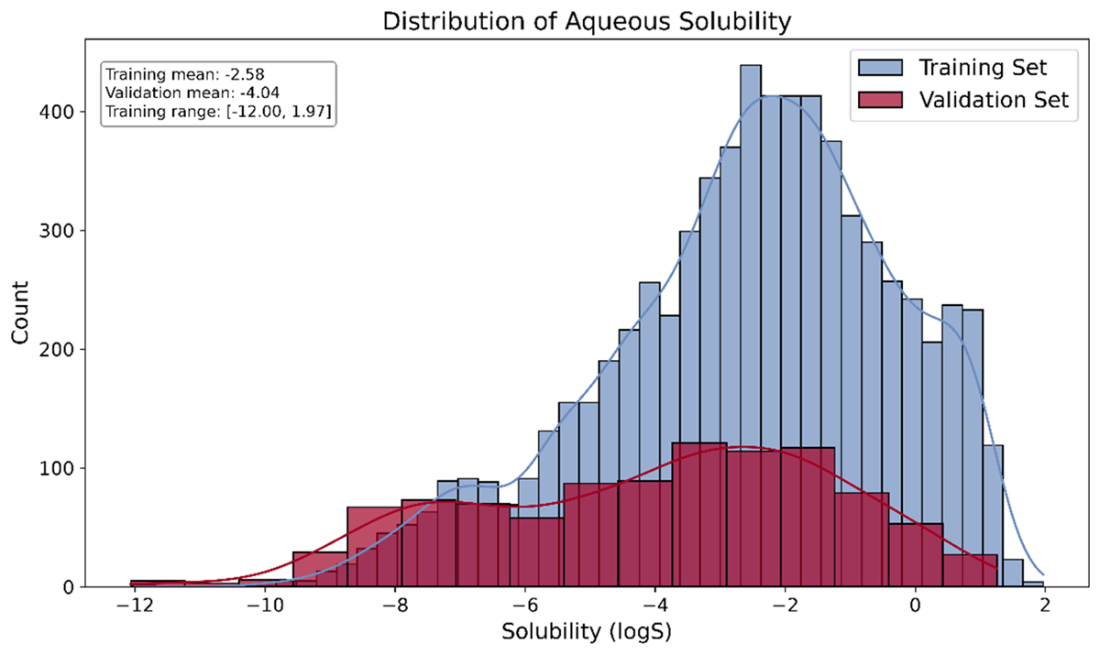
Compare training and validation solubility distributions to spot shifts and unusually broad ranges. section 4.1.2

How Build AI Drug Discovery Pipelines covers it

How deep it goes
Defines the logarithmic scale, interprets practical ranges, and outlines IQR and chemical-domain outlier handling.
Examples
Uses ranges from -12 to 1.97, a typical window of -6 to -3, and the IQR outlier rule.
What you can do after
Evaluate solubility distributions, interpret tenfold changes, and identify extreme observations before modeling.
How it connects
Connects logS with aqueous solubility, molarity, bioavailability, outliers, and physicochemical properties.

Related concepts

This explainer was generated by Manning's knowledge graph from the text of Build AI Drug Discovery Pipelines. The section links point to the parts of the book it draws on.