A belief can seem popular simply because the people expressing it are prominent in your network. The majority illusion occurs when a belief appears more widely accepted than it is in the population overall. section 8.1.1
Red and white roses
On a five-user flower platform, three people prefer red roses and two prefer white roses. Red is the majority preference, but if the white-rose advocates have more followers, users may see their preference more often and mistake it for the majority view. section 8.1.1
People cannot take in everything happening across a platform. Instead, their local view—what they see from the people they follow—can shape their beliefs. When well-connected people hold a minority opinion, that local view can differ from the global picture. section 8.1.1
Figure 8.1 An example of how the shape of the network, i.e., its connections, influences the flow of information. In diagram A, the circle nodes are better connected than the square ones. Because of that, the square nodes would receive more information from the circular ones, giving the impression that their opinion is the majority. In contrast, a different network shape, shown on the right, can lead to a very different spread of information where the square nodes receive the majority of their information from other square nodes.
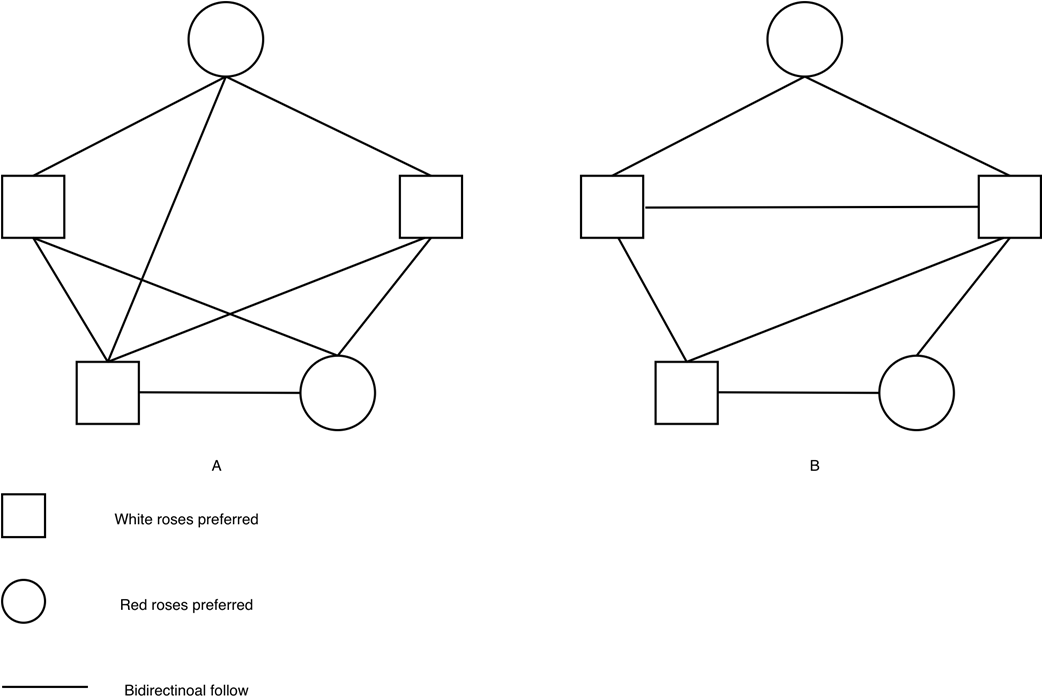
Compare how two network shapes change which opinions users encounter most often. section 8.1.1