Market demand is what customers want: the product, quantity, and delivery timing they seek under specified conditions. It is unconstrained by current availability. Sales occur only when that demand meets supply, so sales records can understate demand whenever stock, shelf availability, product freshness, or other supply conditions prevent a purchase. section 2.2.1 section 3.0 section 3.2
The practical question is not simply “What did we ship?” but “What did customers request?” Forecasting constrained sales can perpetuate stockouts: no inventory produces no sales, a sales forecast predicts zero, purchasing does not replenish, and future sales remain zero. Such a process can appear perfectly accurate while missing demand and lost revenue. section 2.2.1 section 3.4
Treat historical sales as demand data only with clear availability context:
- When no shortage occurred, sales and demand are equivalent enough for sales to represent incoming demand. section 3.0 section 3.2
- Collect orders and retain them in a backlog when possible, preserving the customer’s requested item, quantity, and date. section 3.0 section 3.4
- Track stockouts and censor affected sales periods so a forecasting engine does not interpret constrained low sales as weak demand. section 3.2 section 3.4
- Account for hidden shortages, such as inaccurate inventory records, unavailable shelf stock, or freshness that makes remaining items unacceptable. section 3.2
Chocolate ice cream stockout
Children may still want chocolate ice cream when the truck has none in stock. Demand therefore remains positive, but sales are zero. Reordering from a zero-sales forecast creates a self-reinforcing out-of-stock cycle; recording the request or flagging the shortage preserves a more useful demand signal. section 2.2.1 section 3.0
Figure 3.1 Sales vs. inventory for a product sold online
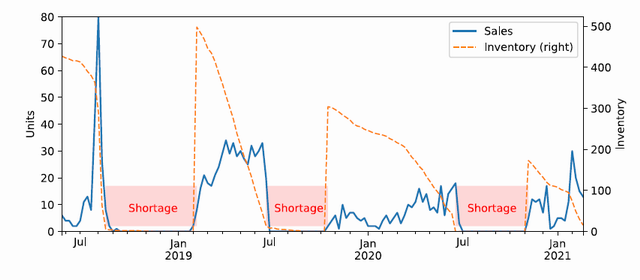
Compare inventory and sales over time to identify periods where sales reveal demand and periods where shortages constrain the observed signal. section 3.2
Demand must also be forecast at the decision level that uses it. A monthly, market-level forecast may be unhelpful when inventory is deployed weekly to warehouses; forecasting weekly by warehouse can better support that decision. Accuracy and bias remain useful checks, but a forecast is valuable only when it helps the supply chain act. section 14.4.1 section 8.1
