Maximum aggregation assigns each record the highest score produced by any detector: final score = max(s1, s2, …, sn). It emphasizes strong evidence from even one detector rather than consensus across the ensemble. section 14.6 section 14.6.1
Use maximum when the ensemble is intended to preserve signals that only some detectors expose.
- Feature-subspace ensembles often favor maximum because one subspace may expose an outlier while others do not. section 14.6.1
- A single exceptionally high detector score can dominate the final ranking, which helps when missing outliers is more concerning than false positives. section 14.6 section 14.6.1
- The trade-off is sensitivity to one unreliable detector; confidence in the individual detectors therefore matters. section 14.6.1
- Choose thresholds separately when necessary, since the same aggregation method can support different balances between false positives and false negatives. section 14.6
A single detector changes the ranking
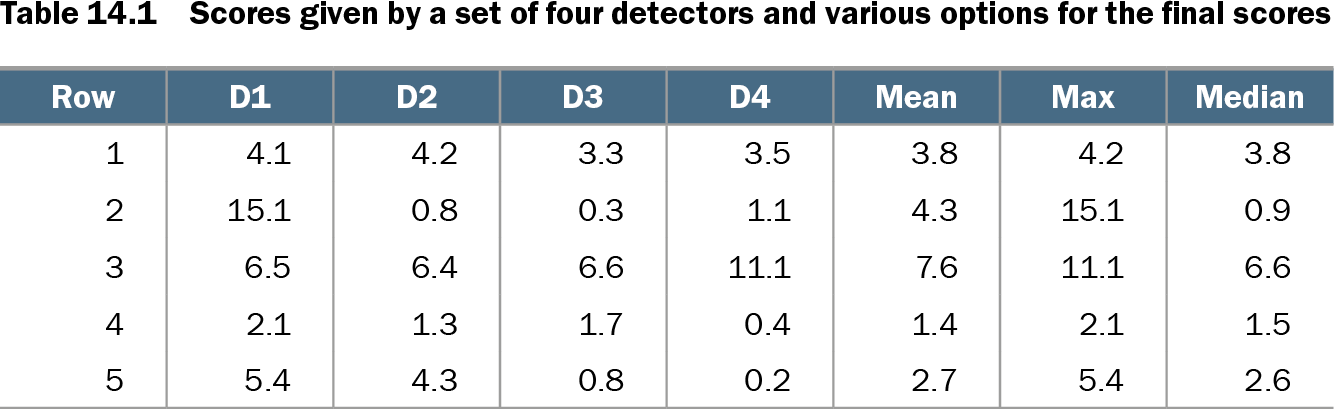
For row 2, detector scores are 15.1, 0.8, 0.3, and 1.1, so maximum gives 15.1. Row 3 has 6.5, 6.4, 6.6, and 11.1, so maximum gives 11.1. Maximum therefore ranks row 2 above row 3, whereas the mean ranks row 3 higher. section 14.6.1
Table 14.1 Scores given by a set of four detectors and various options for the final scores (view table figure)
| Row |
D1 |
D2 |
D3 |
D4 |
Mean |
Max |
Median |
|---|---|---|---|---|---|---|---|
| 1 |
4.1 |
4.2 |
3.3 |
3.5 |
3.8 |
4.2 |
3.8 |
| 2 |
15.1 |
0.8 |
0.3 |
1.1 |
4.3 |
15.1 |
0.9 |
| 3 |
6.5 |
6.4 |
6.6 |
11.1 |
7.6 |
11.1 |
6.6 |
| 4 |
2.1 |
1.3 |
1.7 |
0.4 |
1.4 |
2.1 |
1.5 |
| 5 |
5.4 |
4.3 |
0.8 |
0.2 |
2.7 |
5.4 |
2.6 |
Compare detector scores with mean, maximum, and median values across five records. section 14.6.1