liveBook · Manning

Measure

As explained in Everyday Data Visualization

A data value that represents a quantity and supports meaningful numerical operations such as aggregation or averaging.

A measure is a data value whose quantity supports meaningful numerical operations, such as aggregation, averaging, median, minimum, or maximum. It answers “how much?” rather than describing what something is. section 3.2

Classify values by asking whether numerical operations would produce a useful result:

  • A taste score is a measure: averaging scores or finding their minimum and maximum tells us something useful. section 3.2
  • Fruit type is a dimension because adding or averaging fruit names is meaningless. section 3.2
  • An ID may look numeric but remains a dimension when aggregation would have no meaningful interpretation. section 3.2
  • Dates are typically descriptive dimensions, even when minimum and maximum dates can technically be calculated. section 3.2

Fruit scores

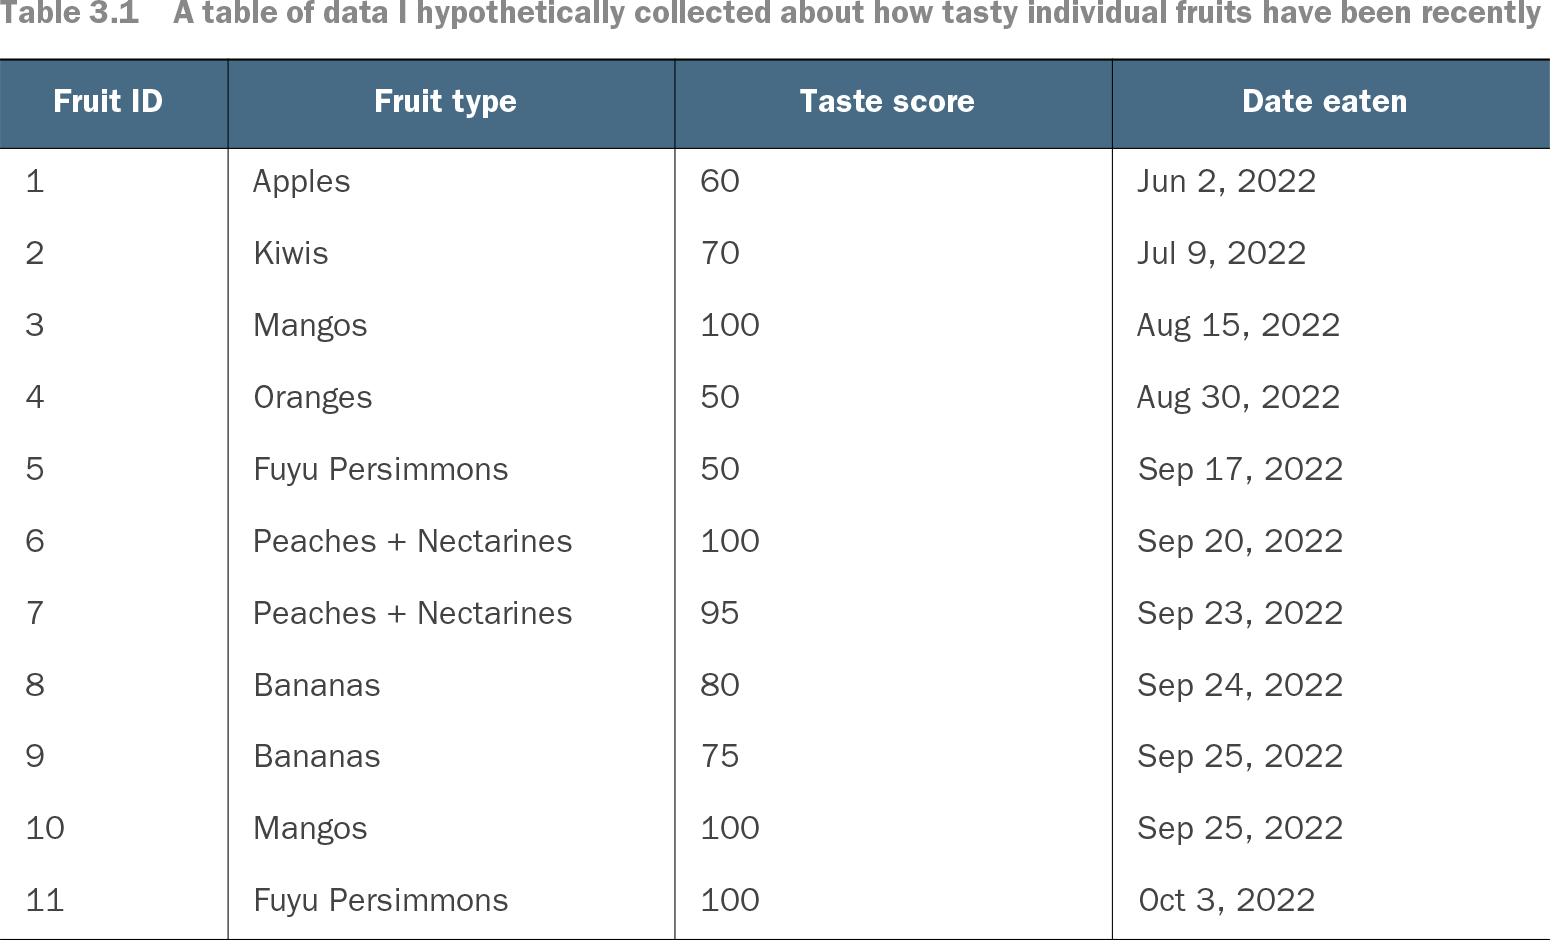
A fruit table can pair the dimension “fruit type” with the measure “taste score.” Grouping rows by fruit type and averaging the scores produces a comparison of typical tastiness; summing arbitrary fruit IDs would produce only numerical noise. section 3.2 section 3.5.1

Table 3.1 A table of data I hypothetically collected about how tasty individual fruits have been recently (view table figure)

Fruit ID

Fruit type

Taste score

Date eaten

1

Apples

60

Jun 2, 2022

2

Kiwis

70

Jul 9, 2022

3

Mangos

100

Aug 15, 2022

4

Oranges

50

Aug 30, 2022

5

Fuyu Persimmons

50

Sep 17, 2022

6

Peaches + Nectarines

100

Sep 20, 2022

7

Peaches + Nectarines

95

Sep 23, 2022

8

Bananas

80

Sep 24, 2022

9

Bananas

75

Sep 25, 2022

10

Mangos

100

Sep 25, 2022

11

Fuyu Persimmons

100

Oct 3, 2022

Inspect the fruit table to see measures and dimensions stored as columns beside individual observations. section 3.5.1

How Everyday Data Visualization covers it

How deep it goes
Distinguishes useful aggregation from meaningless arithmetic and connects measures to data types and table grain.
Examples
Uses fruit taste scores, fruit types, dates, IDs, individual rows, and aggregated bar-chart data as examples.
What it assumes
Teaches the distinction from basic data values while assuming familiarity with simple tables and numerical operations.
What you can do after
Apply the distinction to classify fields and choose meaningful aggregations for visualizations.
How it connects
Connects measures with dimensions, aggregation, data types, table grain, and data visualization.

Related concepts

This explainer was generated by Manning's knowledge graph from the text of Everyday Data Visualization. The section links point to the parts of the book it draws on.