A mel spectrogram represents audio energy across time and frequency, remapping frequency onto the perceptual mel scale. It preserves greater sensitivity to lower-frequency differences, making it useful for speech recognition and audio classification. section 6.3.5
The representation begins with a short-time Fourier transform: overlapping waveform windows become frequency measurements. Time forms the horizontal axis, frequency the vertical axis, and intensity shows energy at each point. section 6.3.5
For multimodal models, an audio encoder divides the mel spectrogram into overlapping patches, flattens and projects them into dense vectors, then adds positional encodings for temporal and frequency context. section 6.3.5
Compute and inspect one
Given a 16 kHz mono waveform, librosa can compute an 80-band mel spectrogram with a 1,024-sample FFT and 256-sample hop. Converting power to decibels and plotting the result exposes the time-frequency structure for inspection.
Figure 6.7 Mel spectrogram of the trumpet example from the Librosa library
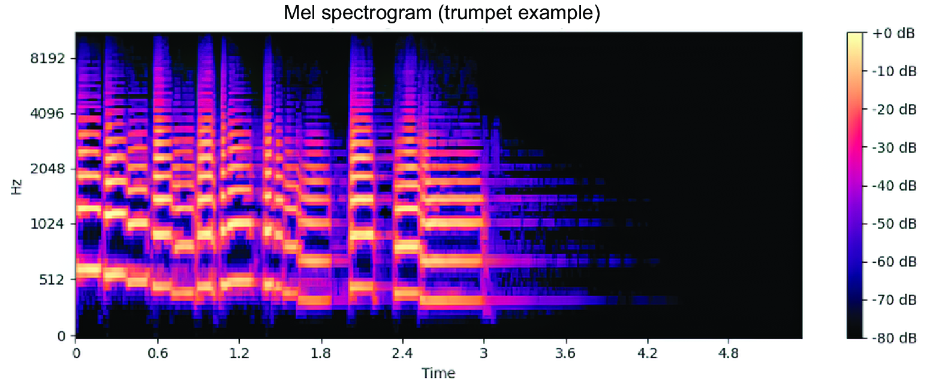
Inspect a trumpet example rendered as a mel spectrogram, with musical energy patterns distributed across time and perceptual frequency. section 6.3.5
The resulting features can bridge raw audio and model-level analysis: an audio-capable transformer can use them to reason about music, transcribe speech, or produce summaries for retrieval and agent pipelines. section 6.3.6
