Min-max normalization linearly maps feature values or detector scores into a specified interval, commonly 0.0 to 1.0. It puts differently scaled quantities on a comparable range without making every feature equally informative by itself. section 2.8 section 4.10
For distance-, density-, and cluster-based outlier detectors, scaling prevents large-range features from dominating pairwise distances. Numeric features must be encoded before scaling, and equal ranges are the usual default when feature importance is unknown. section 3.2 section 4.10
Use min-max normalization with these practical qualifications:
- Scale univariate scores before combining them so features contribute comparably; summing the normalized scores can still produce totals above 1.0 when multiple features are present. section 2.8
- Treat equal weighting as a default rather than a guarantee of equal relevance; task-specific knowledge may justify weighting some features more heavily. section 2.8
- Inspect extreme detector scores: a few very large values can compress moderate scores toward 0.0, especially when combining ensemble outputs. section 14.5.1
- Compare it with standard scaling and robust scaling when outliers or distributional behavior make the choice consequential; robust scaling uses the median and interquartile range. section 4.10
Normalizing MAD scores
Compute MAD-based outlier scores for each nonconstant feature, then apply scikit-learn's MinMaxScaler so every feature's scores lie between 0.0 and 1.0. Sum the resulting row-level scores when a combined outlier score is required. section 2.8
Figure 2.18 The distribution of values and MAD scores for two features in the segment dataset. Region-centroid-row is well-behaved with the maximum MAD score around 3.0. vegde-sd has extreme values, with a maximum MAD score of about 1750.
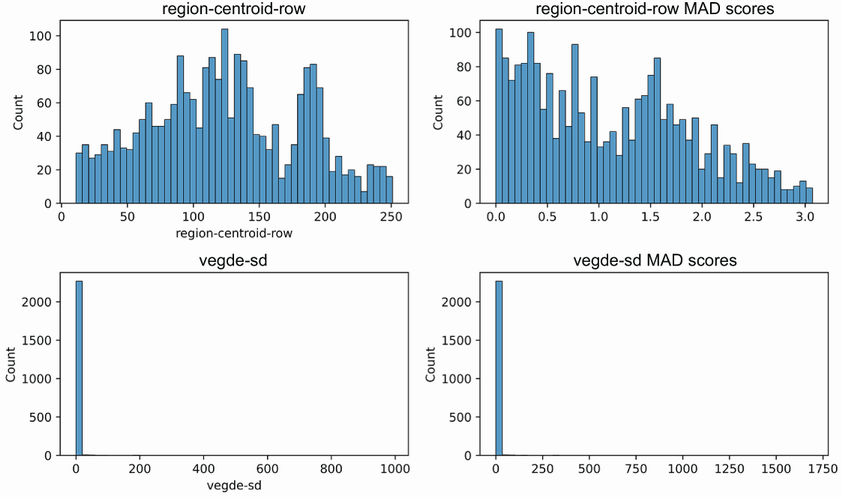
Compare the raw feature distributions with their MAD-score distributions and see why normalization is needed before combining features with sharply different score ranges. section 2.8



